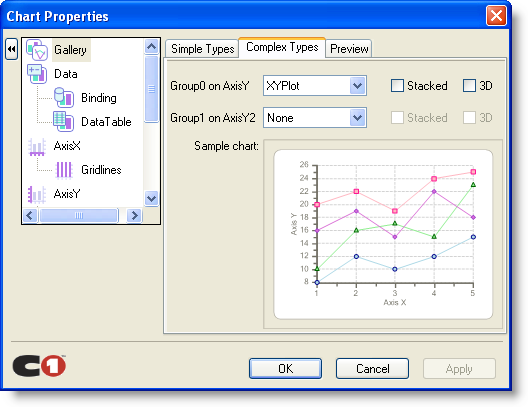
In the Complex Types tab you can specify whether you want to chart one or two chart groups. Also, you can select the type of chart you would like to create in the drop-down box for each group. For each group, you have the option to make the groups stacked and/or 3D. The following image illustrates the elements included in the Complex Types tab of the Gallery section in the Chart Properties dialog box.

Note: If you don't select a chart type for data [Group1] then the elements for data [Group1] will not appear in the list box in the left pane of the Chart Properties dialog box.