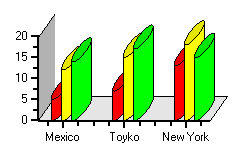
A Cylinder chart is a variation of the Bar and Column charts. It represents the bars or columns as cylinders. The Cylinder chart creates long circular boxes of the same base on both ends. Like all bar and column charts, the Cylinder bar chart is appropriate for comparing individual items or groups of items.

To Change the Chart Type
•Expand the ChartGroups node in the Properties window. Open the ChartGroups Collection Editor by clicking the ellipsis button. In the right pane of the editor, set the ChartType property to Bar, then set the Appearance property to Cylinder.
•An alternate method to change chart type is to right-click the existing chart and select Chart Properties. From the Gallery, select Cylinder.
•Another alternate method is to select Cylinder, from the C1Chart toolbar.