To modify the appearance of the data series using the C1Chart floating toolbar, complete the following steps:
1. Select the
C1Chart control and click on the Open button ![]() to open the C1Chart
floating toolbar if it is not already open.
to open the C1Chart
floating toolbar if it is not already open.
2. Select the Data drop-down arrow from the C1Chart floating toolbar and choose the Edit data series item.
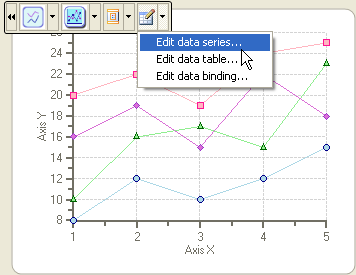
The Chart Properties designer appears for the data series.
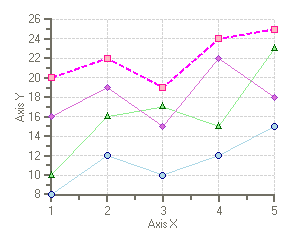
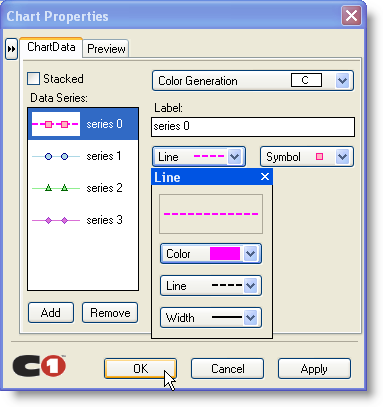
3. Select Series0 and click on the drop-down arrow for the Line property. Modify its Color, Line style, and Width style for its Line property to the following:
•Select Fuchsia from its Color drop-down list box.
•Select the dashed line style from its Line drop-down list box.
•Select level 2 for its Width drop-down list box.
4. Select OK and the new changes for series 0 appears on the chart.