It is common to use charts to display a series of simple values, like product prices. This type of chart is useful because it shows the relative magnitude of each value in a quick and effective way.
The main characteristic of this type of chart is that each point conveys only one piece of information. When creating these charts, the value being displayed is assigned to the Y values of the series. The X values only provide constant spacing between the points, and usually display labels attached to each data point.
The recommended chart types for this type of information are Bar and Pie charts.
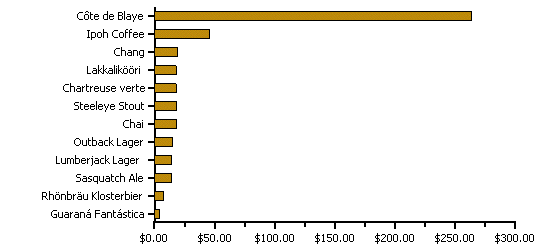
The following illustration shows a simple bar chart with product prices (Beverages from the NorthWind product list).
Note that the bars are displayed horizontally, in order to provide room for the product names along the vertical axis. This is done using the Inverted property.
The following code creates the bar chart in the preceding graphic. The data is used from the Beverages table in the NorthWind product list which can be found in the C:\Program Files\ComponentOne\Studio for Winforms\Common folder. In actual applications, the code would be even simpler because some properties would be set at design time.
' get chart data
Dim data As DataView = _dataSet.Tables("Products").DefaultView
data.Sort = "UnitPrice"
data.RowFilter = "CategoryID = 1" ' beverages
' configure the chart
C1Chart1.Reset()
C1Chart1.ChartArea.Inverted = true
C1Chart1.ChartGroups(0).ChartType = Chart2DTypeEnum.Bar
' create single series for product price
Dim dscoll As ChartDataSeriesCollection = C1Chart1.ChartGroups(0).ChartData.SeriesList
dscoll.Clear()
Dim series As ChartDataSeries = dscoll.AddNewSeries()
series.Label = "Product Prices"
' populate the series
series.PointData.Length = data.Count
Dim i As Integer
For i = 0 To data.Count – 1
series.X(i) = I
series.Y(i) = data(i)("UnitPrice")
Next I
' attach product names to x-axis
Dim ax As Axis = C1Chart1.ChartArea.AxisX
ax.AnnoMethod = AnnotationMethodEnum.ValueLabels
For i = 0 To data.Count – 1
ax.ValueLabels.Add(i, CType(data(i)("ProductName"), String))
Next I
' configure y-axis
Dim ay As Axis = C1Chart1.ChartArea.AxisY
ay.AnnoFormat = FormatEnum.NumericCurrency
•C#
// get chart data
DataView data = _dataSet.Tables["Products"].DefaultView;
data.Sort = "UnitPrice";
data.RowFilter = "CategoryID = 1"; // beverages
// configure the chart
c1Chart1.Reset();
c1Chart1.ChartArea.Inverted = true;
c1Chart1.ChartGroups[0].ChartType = Chart2DTypeEnum.Bar;
// create single series for product price
ChartDataSeriesCollection dscoll = c1Chart1.ChartGroups[0].ChartData.SeriesList;
dscoll.Clear();
ChartDataSeries series = dscoll.AddNewSeries();
series.Label = "Product Prices";
// populate the series
series.PointData.Length = data.Count;
for (int i = 0; i < data.Count; i++)
{
series.X[i] = i;
series.Y[i] = data[i]["UnitPrice"];
}
// attach product names to x-axis
Axis ax = c1Chart1.ChartArea.AxisX;
ax.AnnoMethod = AnnotationMethodEnum.ValueLabels;
for (int i = 0; i < data.Count; i++)
ax.ValueLabels.Add(i, (string)data[i]["ProductName"]);
// configure y-axis
Axis ay = c1Chart1.ChartArea.AxisY;
ay.AnnoFormat = FormatEnum.NumericCurrency;
It is common to show more than one data series on a chart, and that is easy to do with C1Chart. The code would look similar to the above, except you would add additional lists to the ChartDataSeriesCollection.