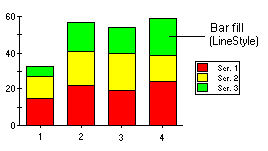
A Stacking Bar chart draws each series as a portion of a stacked bar cluster, the number of clusters being the number of points in the data. Each bar displays the nth data point in each series. Cylinder, Pyramid, and Cone Bar charts can also be stacked by setting the Stacked property to True. Using the LineStyle, the fill properties of each series can be customized. For more information, see Line and Symbol Styles for the Series.
Code Example
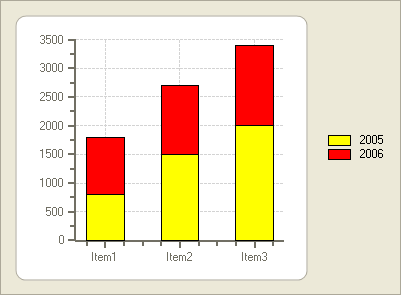
The following example creates a Stacked Bar chart. Just add the C1Chart control to your Visual Studio project, and add the following code to see a running example of the Stacked Bar chart:
Private Sub Form1_Load(ByVal sender As System.Object, ByVal e As System.EventArgs) Handles MyBase.Load
' Clear previous data
C1Chart1.ChartGroups(0).ChartData.SeriesList.Clear()
' Data
Dim items As String() = New String() {"Item1", "Item2", "Item3"}
Dim sales2005 As Integer() = New Integer() {800, 1500, 2000}
Dim sales2006 As Integer() = New Integer() {1000, 1200, 1400}
' Create first series
Dim ds2005 As C1.Win.C1Chart.ChartDataSeries = C1Chart1.ChartGroups(0).ChartData.SeriesList.AddNewSeries()
ds2005.Label = "2005"
ds2005.LineStyle.Color = Color.Yellow
ds2005.X.CopyDataIn(items)
ds2005.Y.CopyDataIn(sales2005)
' Create second series
Dim ds2006 As C1.Win.C1Chart.ChartDataSeries = C1Chart1.ChartGroups(0).ChartData.SeriesList.AddNewSeries()
ds2006.Label = "2006"
ds2006.LineStyle.Color = Color.Red
ds2006.AutoEnumerate = True
ds2006.Y.CopyDataIn(sales2006)
' Set chart type
C1Chart1.ChartGroups(0).ChartType = C1.Win.C1Chart.Chart2DTypeEnum.Bar
C1Chart1.ChartGroups(0).Stacked = True
' Set y-axis minimum
C1Chart1.ChartArea.AxisY.Min = 0
C1Chart1.Legend.Visible = True
' Remove the Axes caption
C1Chart1.ChartArea.AxisX.Text = ""
C1Chart1.ChartArea.AxisY.Text = ""
End Sub
•C#
private void Form1_Load(object sender, EventArgs e)
{
// Clear previous data
c1Chart1.ChartGroups[0].ChartData.SeriesList.Clear();
// Data
string[] items = new string[] { "Item1", "Item2", "Item3"};
int[] sales2005 = new int[] { 800, 1500, 2000};
int[] sales2006 = new int[] { 1000, 1200, 1400};
// Create first series
C1.Win.C1Chart.ChartDataSeries ds2005 =
c1Chart1.ChartGroups[0].ChartData.SeriesList.AddNewSeries();
ds2005.Label = "2005";
ds2005.LineStyle.Color = Color.Yellow;
ds2005.X.CopyDataIn( items);
ds2005.Y.CopyDataIn( sales2005);
// Create second series
C1.Win.C1Chart.ChartDataSeries ds2006 =
c1Chart1.ChartGroups[0].ChartData.SeriesList.AddNewSeries();
ds2006.Label = "2006";
ds2006.LineStyle.Color = Color.Red;
ds2006.AutoEnumerate = true;
ds2006.Y.CopyDataIn( sales2006);
// Set chart type
c1Chart1.ChartGroups[0].ChartType = C1.Win.C1Chart.Chart2DTypeEnum.Bar;
c1Chart1.ChartGroups[0].Stacked = true;
// Set y-axis minimum
c1Chart1.ChartArea.AxisY.Min = 0;
c1Chart1.Legend.Visible = true;
// Remove the Axes caption
c1Chart1.ChartArea.AxisX.Text = "";
c1Chart1.ChartArea.AxisY.Text = "";
}
The code example above produces the following chart: