To filter the categories from the data, complete the following steps:
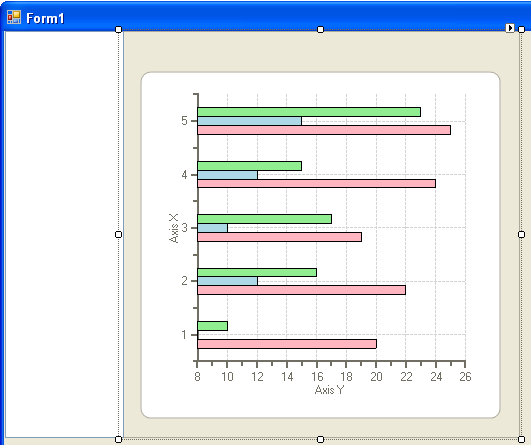
1. From the Toolbox, double-click the ListBox control to add it to the form. Dock it to the left of the C1Chart control so it appears like the following:

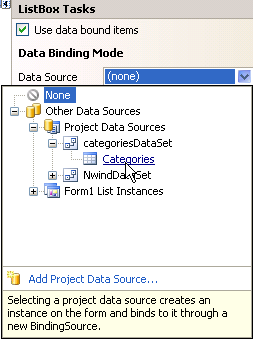
2. Select the ListBox control and click on its smart tag to open the menu. Select Use databound items and then in the Data Source drop-down listbox, select Categories from Other Data Sources>Project Data Sources>CategoriesDataSet.

3. Set the DisplayMember to CategoryName.
4. Double-click on the ListBox to create a listbox1_SelectedIndexChanged event.
5. Add the following code in the listbox1_SelectedIndexChanged event to filter the CategoryID to the listbox when the user selects a category item:
Private Sub listBox1_SelectedIndexChanged(sender As Object, e As System.EventArgs) Handles listBox1.SelectedIndexChanged
If listBox1.SelectedIndex >= 0 Then
Dim categoryID As String = Me.categoriesDataSet1.Categories(listBox1.SelectedIndex).CategoryID.ToString()
Me.dataView1.RowFilter = "CategoryID = " + categoryID
Me.c1Chart1.Header.Text = listBox1.Text
End If
End Sub
•C#
private void listBox1_SelectedIndexChanged(object sender, System.EventArgs e)
{
if (listBox1.SelectedIndex >= 0)
{
string categoryID = this.categoriesDataSet1.Categories[listBox1.SelectedIndex].CategoryID.ToString();
this.dataView1.RowFilter = "CategoryID = " + categoryID;
this.c1Chart1.Header.Text = listBox1.Text;
}
}
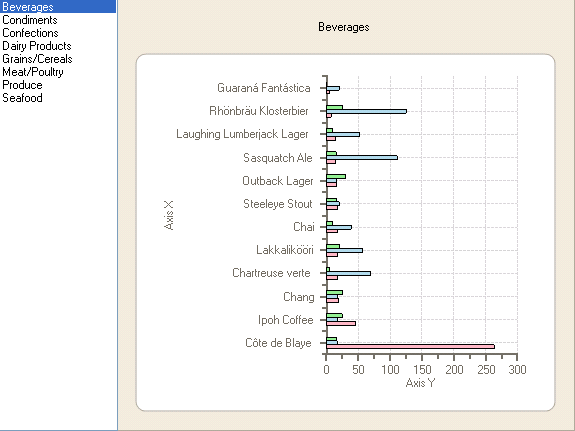
6. In the Form1_Load event add the following code to force the new calculation after the refill so the first category of product items, Beverages, appears rather than all of the unfiltered categories:
'force the new calculation after the refill
listBox1_SelectedIndexChanged(Me.listBox1, New EventArgs())
•C#
//force the new calcuation after the refill
listBox1_SelectedIndexChanged(this.listBox1, new EventArgs());
7. Run the application and select a category from the listbox to observe the chart filter the data.
Congratulations! You successfully bound data to the chart. In the next step you will modify the appearance of the chart.
