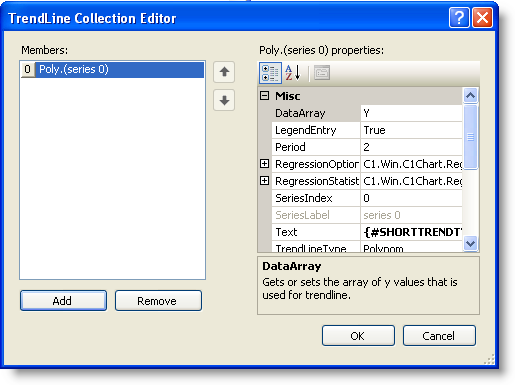
The TrendLine Collection Editor is used for adding or modifying TrendLines that approximate the data which the functions trend at design time. For more information on TrendLines see, Working with TrendLines.
To Access the TrendLine Collection Editor
1. Right-click on the C1Chart control and select Properties from its context menu.
2. In the Properties window, expand the ChartGroups node, then expand the Group0 or Group1 node.
3. Expand the ChartData node, then click on the ellipsis button next to the TrendsList property. The TrendLine Collection Editor appears.

Properties available in the TrendLine Collection
Editor![]()
The following properties are available for the user in the TrendLine Collection Editor at design time or they can be used in the TrendLine class at run time:
Misc Properties of the TrendLine Collection Editor:
Members | Description |
Gets or sets the array of y values that is used for the trendline. | |
Gets or sets whether the trendline appears in the legend. | |
Gets or sets period for Moving Average trendline. | |
Gets the options for regression calculation. | |
Gets or sets the number of terms in regression equation. Only for polynomial and fourier trend lines. | |
Gets or sets whether the trend line uses Yintercept property. Only for polynomial trend line. | |
Gets or sets the y value at which trend line intercepts x =0 line. Only for polynomial trend line. | |
Gets the coefficients of regression equation. | |
Gets the degrees of freedom. | |
Gets the F-observed(F-statistic) value. | |
Gets the coefficient of determination(R-squared). | |
Gets the standard error for the y estimate. | |
Gets the sum of squares due to error. | |
Gets the sum of squares due to regression. | |
Gets or sets the data series index that is used for trendline plotting. | |
Gets the data series label that is used for trendline plotting. | |
Gets or sets the text that will be shown in legend. | |
Gets or sets the type of trendline. |
Plot Properties of the TrendLine Collection Editor:
Members | Description |
Gets or sets how long the trendline extends comparing series data minimum. | |
Gets or sets how long the trendline extends comparing series data maximum. | |
Gets or sets the line used to plot the TrendLine. | |
Gets or sets the color of the line. | |
Gets or sets the pattern of the line. | |
Gets or sets the thickness of the line. | |
Gets or sets the method of trendline plotting. | |
Gets or sets the number of points of trendline plotting. | |
Gets or sets whether the trendline is plotted over or behind data. | |
Gets or sets whether the trendline is visible. |