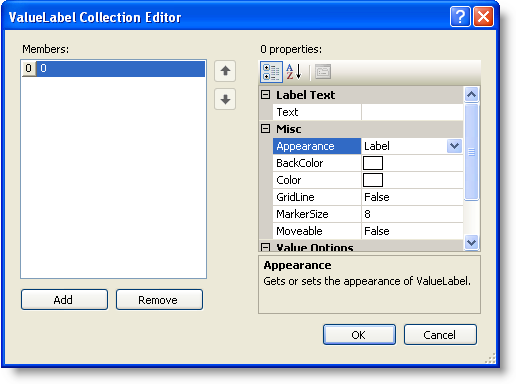
The ValueLabel Collection Editor is used for adding or modifying the properties in the ValueLabels class. ValueLabels displays text defined at a specific axis coordinate. For more information on ValueLabels, see Value Labels Annotation.
To Access the ValueLabel Collection Editor
1. Right-click on the C1Chart control and select Properties from its context menu.
2. In the Properties window, expand the ChartArea node, then expand the AxisX, AxisY, or AxisY2 node and click on the ellipsis button next to the ValueLabels property. The ValueLabel Collection Editor appears.

Properties of the ValueLabel Collection
Editor![]()
The following properties are available for the user in the ValueLabel Collection Editor at design time or they can be used in the ValueLabel class at run time:
Members | Description |
Gets or sets the displayed text value for the ValueLabel. | |
Gets or sets the appearance of ValueLabel. | |
Get or sets the background color of ValueLabel. | |
Gets or sets the color of the ValueLabel. | |
Gets or sets a value indicating whether a grid line is drawn at the ValueLabel. | |
Gets or sets the marker size of ValueLabel. | |
Gets or sets a value indicating whether a ValueLabel can be dragged by the user. | |
Gets or sets the axis value to be replaced by the ValueLabel using a DateTime value. | |
Gets or sets the axis value to be replaced by the ValueLabel using a double value. |