The Chart Properties designer provides an easy and interactive way to create and modify a new or existing chart. Like the Chart Wizard, it contains the same design and function as Step 1: Choose Chart Type and Step 3: Edit chart data. However, it also includes additional property settings for the x and y axis along with appearance settings for the header, footer, legend, chart area, and plot area of the chart.
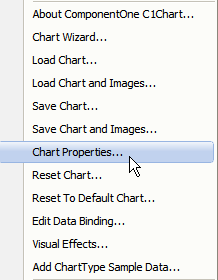
The Chart Properties designer can be accessed at design time by right-clicking on the C1Chart control and selecting Chart Properties from its context menu:
The Chart Properties designer provides more options to address specific details with the design of the chart you are developing. The following topics provide a visual detail of the Chart Properties designer interface and explain the functionality of each element in the Chart Properties designer.