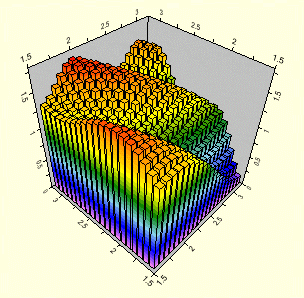
The 3D Bar chart displays each data point as a single bar drawn from the Z-value to the origin. Spacing between the adjacent bars can be added when using either grid or irregular grid data layout. Like the 2D Bar chart it is useful for comparing individual items or groups of items.
Chart3DTypeEnum.Bar
To set the 3D chart type to Bar at design time:
3. Expand the ChartGroups node in the Properties window, then expand Group0.
4. Locate the ChartType property and select Bar.
To programmatically set the 3D chart type to Bar:
C1Chart3D1.ChartGroups(0).ChartType = Chart3DTypeEnum.Bar
•C#
C1Chart3D1.ChartGroups[0].ChartType = Chart3DTypeEnum.Bar;