The attributes that define how contour lines and zoning colors look in the chart are called a ContourStyle. The chart has a built-in set of one hundred styles. A subset of these styles is used for the chart display, based on the number of contour levels in the chart. Individual styles can be customized.
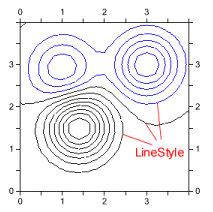
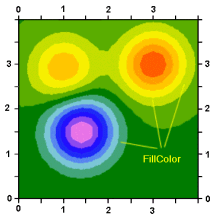
The following two images display the LineStyle for the contour lines and the FillColor for the zoning colors:
|
|
Every ContourStyle has a FillColor and a LineStyle. FillColors are used for zoning colors. LineStyles are used for contour lines. Most charts will not need to customize ContourStyles. Situations where customization is needed include:
•To control the precise ContourStyle for any particular level
•To display more than one hundred levels
•To uniquely identify contour lines (the built-in styles use the same LineStyle for every ContourStyle)