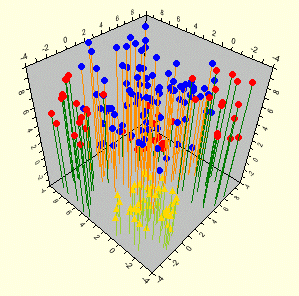
The 3D Scatter plots consist of one or more series of individual points. They show a relationship between three or more variables which represent the X, Y, and one or more Z coordinates of each point. To create a better display of the 3D Scatter plot, you can add drop lines between the plotted points and the origin like shown in the following image:
Chart3DTypeEnum.Scatter
To set the 3D chart type to Scatter at design time:
1. Expand the ChartGroups node in the Properties window, then expand Group0.
2. Locate the ChartType property and select Scatter.
To programmatically set the 3D chart type to Scatter:
C1Chart3D1.ChartGroups(0).ChartType = Chart3DTypeEnum.Scatter
•C#
C1Chart3D1.ChartGroups[0].ChartType = Chart3DTypeEnum.Scatter;