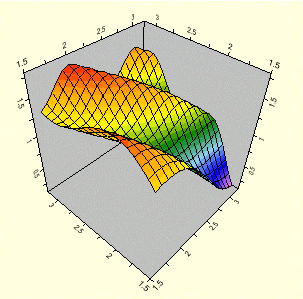
The 3D Surface charts display the data as three dimensional shaded or meshed surface with a Z-axis. They are based on X, Y, and Z axes, with more variation in the Z variable than the X or Y variables. The shaded or meshed surface is created from the information collected on how the data points are connected. The surface between data points can be estimated through interpolation.
Chart3DTypeEnum.Surface
To set the 3D chart type to Surface at design time:
1. Expand the ChartGroups node in the Properties window, then expand Group0.
2. Locate the ChartType property and select Surface.
To programmatically set the 3D chart type to Surface:
C1Chart3D1.ChartGroups(0).ChartType = Chart3DTypeEnum.Surface
•C#
C1Chart3D1.ChartGroups[0].ChartType = Chart3DTypeEnum.Surface;