To create a 4D chart, complete the following steps:
1. Add the grid dataset (regular or irregular) data to the chart. See 3D Data for information on adding data to a chart.
2. Add the contour data to the chart. This data will be used to derive the zoning and contouring colors for the fourth dimension of chart information. The contour data is defines by ContourData property of Chart3DData object.
3. Set the IsShaded and/or IsZoned Contour object properties of Chart3DGroup.
' 1 step
' Create dataset with sample data
Dim rnd As Random = New Random()
Dim i, j As Integer
Dim z(20, 20) As Double
For i = 0 To 20
For j = 0 To 20
z(i,j) = 200 - ((i - 10) * (i - 10) + (j - 10) * (j - 10))
Next j
Next i
Dim gridset As Chart3DDataSetGrid = New Chart3DDataSetGrid(0, 0, 1, 1, z)
C1Chart3D1.ChartGroups(0).ChartData.Set = gridset
' 2 step
' Create 4-dimension values array and put it to the chart
Dim contour(20, 20) As Double
For i = 0 To 20
For j = 0 To 20
contour(i, j) = rnd.NextDouble()
Next j
Next i
C1Chart3D1.ChartGroups(0).ChartData.ContourData = contour
' 3 step
' Set zoned chart
C1Chart3D1.ChartGroups(0).Contour.IsZoned = True
C1Chart3D1.ChartGroups(0).Contour.NumLevels = 20
C1Chart3D1.ChartGroups.ContourStyles.ColorSet = ColorSetEnum.RevRainbow
•C#
// 1 step
// Create dataset with sample data
Random rnd = new Random();
int i, j;
double[,] z = new double[21, 21];
for( i=0; i<z.GetLength(0); i++)
{
for( j=0; j<z.GetLength(1); j++)
{
z[ i, j] = 200 - (( i-10)*(i-10) + (j-10)*(j-10));
}
}
Chart3DDataSetGrid gridset=new Chart3DDataSetGrid(0,0,1,1,z);
C1Chart3D1.ChartGroups[0].ChartData.Set = gridset;
// 2 step
// Create 4-dimension values array and put it to the chart
double[,] contour = new double[21, 21];
for( i=0; i<contour.GetLength(0); i++)
{
for( j=0; j<contour.GetLength(1); j++)
{
contour[ i, j] = rnd.NextDouble();
}
}
C1Chart3D1.ChartGroups[0].ChartData.ContourData = contour;
// 3 step
// Set zoned chart
C1Chart3D1.ChartGroups[0].Contour.IsZoned = true;
C1Chart3D1.ChartGroups[0].Contour.NumLevels = 20;
C1Chart3D1.ChartGroups.ContourStyles.ColorSet = ColorSetEnum.RevRainbow;
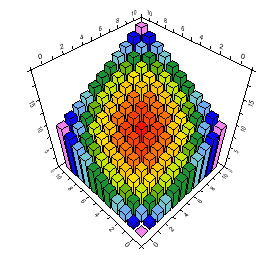
In Bar charts, each bar is displayed as a single solid color according to the zoned height of the bar:
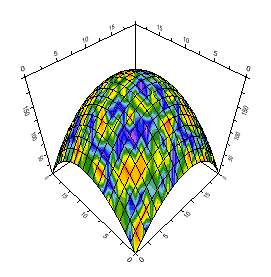
In Surface charts, the fourth dimension is displayed as zoning and contouring colors.
Note: The grid dataset and contour data array must have the same dimensions. If these conditions are not met, a 4D chart is not displayed.