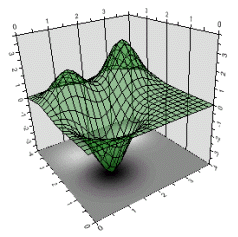
Use the Transparency property to set transparency of data drawing. Valid values of Transparency are 0 through 255. 0 – transparent, 255 – opaque.
Note: The transparency is not applied to Zoned and Contour charts.