Use the ColumnMeshFilter and RowMeshFilter properties of the Chart3DSurface class to define how to filter the display of mesh lines. The chart can automatically determine the best filter, or specify a positive integer to use.
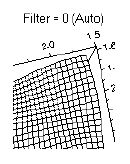
•When these properties are set to 0, the chart automatically determines the best filter based on the density of the mesh. As the chart data increases or the size of the chart control decreases, the chart performs more mesh filtering.
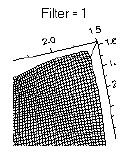
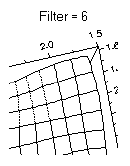
•When these properties are greater than 0, the chart provides fixed mesh filtering. Higher values cause fewer mesh lines to be drawn. For example, a value of 5 filters the mesh so that every fifth mesh line is drawn.
The ColumnMeshFilter and RowMeshFilter properties can be accessed at design time under the Surface node of ChartGroup Collection Editor.
The first Surface chart in the following table represents the default value setting, zero, for the ColumnMeshFilter and RowMeshFilter, the second Surface chart represents the ColumnMeshFilter and RowMeshFilter properties set to 1, and the last Surface chart represents the ColumnMeshFilter and RowMeshFilter properties set to 6.
|
|
|