Whenever data exists in the chart, a Legend is automatically generated. The chart assigns the name specified in the ChartDataSeries object for the series as the series identifier. LineStyle and SymbolStyle determine the symbols that accompany the series name in the Legend. The positioning, border, colors and font used for the Legend can be customized.
To programmatically modify the Legend properties:
Sample property settings are listed below:
C1Chart3D1.Legend.Compass = CompassEnum.East
C1Chart3D1.Legend.Style.Border.BorderStyle = BorderStyleEnum.Solid
C1Chart3D1.Legend.Style.Border.Thickness = 3
C1Chart3D1.Legend.Style.Border.Color = Color.Black
C1Chart3D1.Legend.Style.BackColor = Color.Gray
C1Chart3D1.Legend.Text = "Legend Text"
•C#
c1Chart3D1.Legend.Compass = CompassEnum.East;
c1Chart3D1.Legend.Style.Border.BorderStyle = BorderStyleEnum.Solid;
c1Chart3D1.Legend.Style.Border.Thickness = 3;
c1Chart3D1.Legend.Style.Border.Color = Color.Black;
c1Chart3D1.Legend.Style.BackColor = Color.Gray;
c1Chart3D1.Legend.Text = "Legend Text";
Note: In VB.NET, it is still possible to use the With and End With statement which may make it easier to show repeated use of the same object.
The code above would look as follows using this method:
With C1Chart3D1.Legend
.Compass = CompassEnum.East
With .Style
With.Border
.BorderStyle = BorderStyleEnum.Solid
.Thickness = 3
.Color = Color.Black
End With
.BackColor = Color.Gray
End With
.Text = "Legend Text"
End With
•C#
C1.Win.C1Chart3D.Legend legend = C1Chart3D1.Legend;
C1.Win.C1Chart3D.Style style = legend.Style;
C1.Win.C1Chart3D.Border border = style.Border;
legend.Compass = CompassEnum.East;
border.BorderStyle = BorderStyleEnum.Solid;
border.Thickness = 3;
border.Color = Color.Black;
style.BackColor = Color.Grey;
legend.Text = "Legend Text";
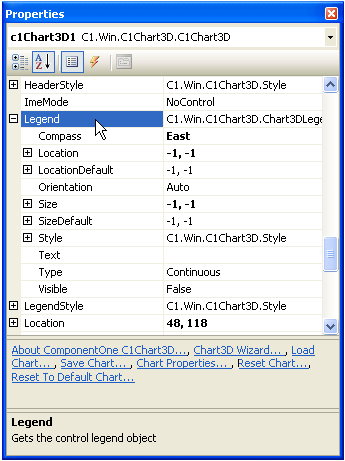
To modify the Legend properties through the Properties window:
1. In the Properties window, expand the Legend node.
2. Modify the properties as desired. For more information, see 3D Chart Legend.