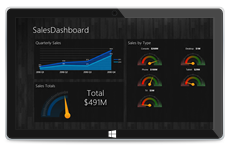
Create date-driven dashboards with stunning ComponentOne Studio for WinJS. Our Charts and Gauges are derived from Wijmo and are proven HTML5 tools. They feature engaging interactions like animation, data transitions and gesture support. ComponentOne visualization controls will help you build immersive Windows 8 dashboard applications.

The controls included in this Beta release are:
•Bar & Column Chart
•Bubble Chart
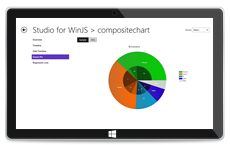
•Composite Chart
•Line & Area Chart
•Pie & Donut Chart
•Scatter Chart
•Linear Gauge
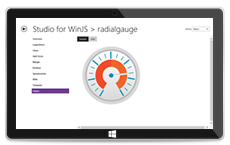
•Radial Gauge
Charts
Visualize your data with the most advanced WinJS charting controls. ComponentOne Charts for WinJS supports all popular 2D chart types, flexible data binding, run-time interaction, rich styling elements and many more advanced features. Take your Windows Store apps to the next level today!

Gauges
Add some flare to your dashboards with modern looking and interactive gauges. ComponentOne Gauges for WinJS includes several gauge controls to enhance your data visualizations and business dashboards. They provide you an attractive way to display your data on a Windows tablet.
