


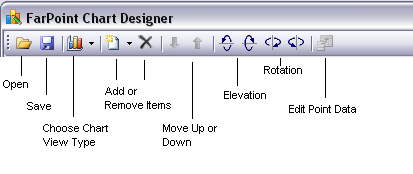
The Chart Designer icons can be used to save the chart to a file, change the chart view type, add or remove items, elevate or rotate the chart, and edit data points.
| Icon | Description |
|---|---|
| Open | This allows you to open the chart control from an XML file. |
| Save | This allows you to open the chart control to an XML file. |
| Chart View Type | This allows you to change the view type to 2D or 3D. |
| Add Items | This allows you to add items to the chart (drop-down list under the Add option). |
| Remove Items | This allows you to move up or down the list if you have created multiple series. |
| Elevation | This allows you to rotate the graph counterclockwise around the horizontal axis. |
| Rotation | This allows you to rotate the graph counterclockwise around the vertical axis. |
| End Point Data | This allows you to bring up the data points in the chart (added with the Double Collection Editor under PlotAreas, Series, and Values). |
Return to Using the Chart Designer.