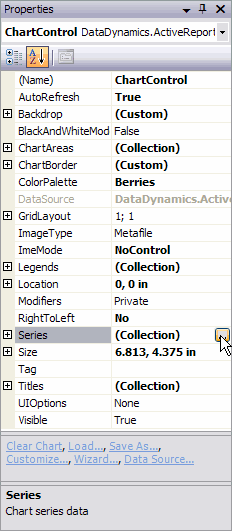
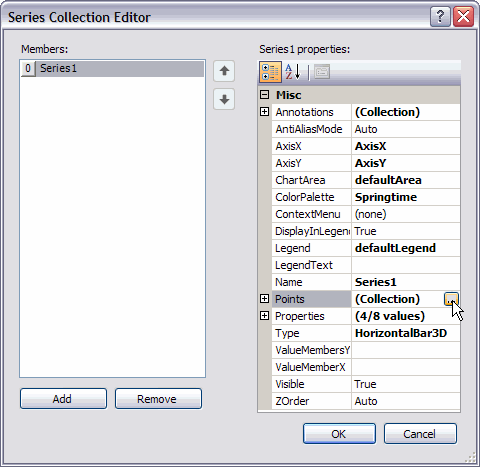
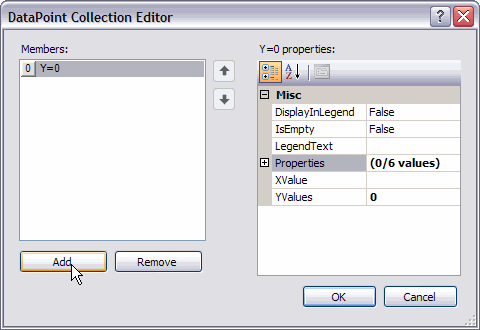
Each chart type in the ActiveReports Chart control contains specific properties that apply to it. Set the chart type and chart-specific properties in the Series Collection Editor dialog box accessed through the Series property in the property grid and in the DataPoint Collection dialog box accessed through the Points property in the Series dialog box.


When a specific property is set on the Series object, it is applied to all data points objects in the series unless a different value for the property has been set on a specific data point. In that case, the data point property setting overrides the series property setting for that particular data point. Note that for charts bound to a data source, you do not have access to the DataPoint collection in the dialog.
Setting chart-specific properties at design time
To set custom properties for a chart at design time, set the Properties attribute of the series or data points object from the Visual Studio .NET Properties Window by clicking on the Series (Collection) property and opening the Series Collection Editor dialog.
Note: If you specify the value for any of the custom properties, this value is not cleared when you change the ChartType. Although this will show properties that do not apply to certain ChartTypes, it has the advantage of keeping your settings in case you accidentally change the ChartType.
Setting chart-specific properties at run time
To set custom properties for a chart at run time on the series, reference the series by name or index and use the string Properties attribute name you wish to set.
' Visual Basic
' Sets the shape for bubbles on a bubble chart to diamond
Me.ChartControl1.Series(0).Properties("Shape") = Chart.MarkerStyle.Diamond
// C#
// Sets the shape for bubbles on a bubble chart to diamond
this.ChartControl1.Series[0].Properties["Shape"] = DataDynamics.ActiveReports.Chart
	.MarkerStyle.Diamond;
To set custom properties for a chart at run time on the data points object, reference the series by name or index, reference the data point by index and use the string Properties attribute name you wish to set.
' Visual Basic
' Sets the explode factor on a doughnut chart for the second point in the series
Me.ChartControl1.Series(0).Points(1).Properties("ExplodeFactor") = 0.5F
// C#
// Sets the explode factor on a doughnut chart for the second point in the series
this.ChartControl1.Series[0].Points[1].Properties["ExplodeFactor"] = .5f;
Chart Standard Properties
- Backdrop: Gets or sets the backdrop information for the series. Does not apply to Bezier, Line, LineXY, Line3D, PlotXY, or Scatter charts.
- BorderLine: Gets or sets the line information used to draw the border of the series. Does not apply to Bezier, Line, LineXY, PlotXY, or Scatter charts.
- Line: Gets or sets the line information for the series. Only applies to Bezier, Line, and LineXY charts.
- Marker: Gets or sets the ToolTip settings for the series.
- ToolTip: Gets or sets the ToolTip information for the series.
Charts and Custom Properties
- Area (none)
- Area3D
- LineBackdrop Gets or sets the backdrop information for the 3D line.
- Thickness Gets or sets the thickness of the 3D line.
- Width Gets or sets the width of the 3D line.
- Bar2D
- Gap Gets or sets the space between the bars of each X axis value.
- Bar3D
- BarTopPercent Gets or sets the percentage of the top of the bar that is shown for Cone or Custom BarTypes.
- BarType Gets or sets the type of bars that are displayed. Values are Bar, Cylinder, Cone, Pyramid, and Custom.
- Gap Gets or sets the space between the bars of each X axis value.
- PointBarDepth Gets or sets the thickness of the 3D bar.
- RotationAngle Gets or sets the starting horizontal angle for custom 3D bar shapes. Can only be used with the Custom BarType.
- VertexNumber Gets or sets the number of vertices for the data point, used to create custom 3D bar shapes. Can only be used with the Custom BarType. Bars must contain 3 or more vertices.
- Bezier (none)
- Bubble
- MaxSizeFactor Gets or sets the maximum size of the bubble radius. Values must be less than or equal to 1. Default is .25.
- MaxValue Gets or sets the bubble size that is used as the maximum.
- MinValue Gets or sets the bubble size that is used as the minimum.
- Shape Gets or sets the shape of the bubbles. Uses or returns a valid MarkerStyle enumeration value.
- BubbleXY
- MaxSizeFactor Gets or sets the maximum size of the bubble radius. Values must be less than or equal to 1. Default is .25.
- MaxValue Gets or sets the bubble size that is used as the maximum.
- MinValue Gets or sets the bubble size that is used as the minimum.
- Shape Gets or sets the shape of the bubbles. Uses or returns a valid MarkerStyle enumeration value.
- Candle
- BodyDownswingBackdrop Gets or sets the backdrop information used to fill the downswing rectangle.
- BodyUpswingBackdrop Gets or sets the backdrop information used to fill the upswing rectangle.
- BodyWidth Gets or sets the width of the rectangle used to show upswing or downswing.
- Wickline Gets or sets the line information for the wick line.
- ClusteredBar
- BarTopPercent Gets or sets the percentage of the top of the bar that is shown for Cone or Custom BarTypes.
- BarType Gets or sets the type of bars that are displayed. Values are Bar, Cylinder, Cone, Pyramid, and Custom.
- Gap Gets or sets the space between the bars of each X axis value.
- PointBarDepth Gets or sets the thickness of the 3D bar.
- RotationAngle Gets or sets the starting horizontal angle for custom 3D bar shapes. Can only be used with the Custom BarType.
- VertexNumber Gets or sets the number of vertices for the data point, used to create custom 3D bar shapes. Can only be used with the Custom BarType. Bars must contain 3 or more vertices.
- Doughnut
- ExplodeFactor Gets or sets the amount of separation between data point values. The value must be less than or equal to 1. To explode one section of the doughnut chart, set ExplodeFactor on the data point instead of on the series.
- HoleSize Gets or sets the inner radius of the chart. If set to 0, the chart looks like a pie chart. The value must be less than or equal to 1.
- OutsideLabels Gets or sets a value indicating whether the data point labels appear outside the chart.
- StartAngle Gets or sets the horizontal start angle for the series.
- Doughnut3D
- ExplodeFactor Gets or sets the amount of separation between data point values. The value must be less than or equal to 1. To explode one section of the doughnut chart, set ExplodeFactor on the data point instead of on the series.
- HoleSize Gets or sets the inner radius of the chart. If set to 0, the chart looks like a pie chart. The value must be less than or equal to 1.
- OutsideLabels Gets or sets a value indicating whether the data point labels appear outside the chart.
- StartAngle Gets or sets the horizontal start angle for the series data points.
- HiLo
- HiLoLine Gets or sets the line information for the hi-lo line.
- HiLoOpenClose
- HiLoLine Gets or sets the line information for the hi-lo line.
- CloseLine Gets or sets the line information for the close line.
- OpenLine Gets or sets the line information for the open line.
- TickLen Gets or sets the length of the tick for the open and close lines.
- HorizontalBar
- Gap Gets or sets the space between the bars of each X axis value.
- HorizontalBar3D
- BarTopPercent Gets or sets the percentage of the top of the bar that is shown for Cone or Custom BarTypes.
- BarType Gets or sets the type of bars that are displayed. Values are Bar, Cylinder, Cone, Pyramid, and Custom.
- Gap Gets or sets the space between the bars of each X axis value.
- PointBarDepth Gets or sets the thickness of the 3D bar.
- Line (none)
- Line3D
- LineBackdrop Gets or sets the backdrop information for the 3D line.
- Thickness Gets or sets the thickness of the 3D line.
- Width Gets or sets the width of the 3D line.
- LineXY (none)
- PlotXY (none)
- Scatter (none)
- StackedArea (none)
- StackedBar
- Gap Gets or sets the space between the bars of each X axis value.
- StackedBar3D
- BarTopPercent Gets or sets the percentage of the top of the bar that is shown for Cone or Custom BarTypes.
- BarType Gets or sets the type of bars that are displayed. Values are Bar, Cylinder, Cone, Pyramid, and Custom.
- Gap Gets or sets the space between the bars of each X axis value.
- VertexNumber Gets or sets the number of vertices for the data point, used to create custom 3D bar shapes. Can only be used with the Custom BarType. Bars must contain 3 or more vertices.
- StackedArea100Pct (none)
- StackedBar100Pct
- Gap Gets or sets the space between the bars of each X axis value.
- StackedBar3D100Pct
- BarTopPercent Gets or sets the percentage of the top of the bar that is shown for Cone or Custom BarTypes.
- BarType Gets or sets the type of bars that are displayed. Values are Bar, Cylinder, Cone, Pyramid, and Custom.
- Gap Gets or sets the space between the bars of each X axis value.
- VertexNumber Gets or sets the number of vertices for the data point, used to create custom 3D bar shapes. Can only be used with the Custom BarType. Bars must contain 3 or more vertices.
Copyright © 2004-2005 Data Dynamics, Ltd. All rights reserved.