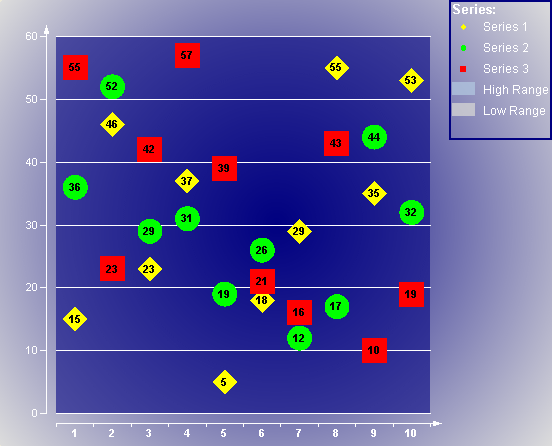
The Chart control automatically creates a legend item for each series added to a chart at design time and sets the Legend property for each series by default. However, the legend's Visible property must be set to True for the legend to show with the chart. The text for each default legend entry is taken from the Name property on the series.

The following code demonstrates how to create a legend at run time, add it to the legends collection for the Chart object and set the legend property of the series to the new legend, resulting in the legend shown above.
Note: Each Series to be shown in the Legend must have a Name. If the Name property is not set, the Series does not show up in the Legend.
' Visual Basic
' create the legend and title for the legend
Dim legend1 As New DataDynamics.ActiveReports.Chart.Legend
Dim lHeader As New DataDynamics.ActiveReports.Chart.Title
' set the properties for the legend title
lHeader.Backdrop = New DataDynamics.ActiveReports.Chart.Graphics.Backdrop(Chart.Graphics _
	.BackdropStyle.Transparent, Color.White, Color.White, Chart.Graphics.GradientType _
	.Vertical, Drawing2D.HatchStyle.DottedGrid, Nothing, Chart.Graphics.PicturePutStyle _
	.Stretched)
lHeader.Border = New DataDynamics.ActiveReports.Chart.Border(New Chart.Graphics.Line(Color _
	.White, 2, Chart.Graphics.LineStyle.None), 0, Color.Black)
lHeader.Font = New DataDynamics.ActiveReports.Chart.FontInfo(Color.White, New _
	System.Drawing.Font("Arial", 10.0F, FontStyle.Bold))
lHeader.Text = "Series:"
' set the properties for the legend and add it to the legends collection
legend1.Alignment = DataDynamics.ActiveReports.Chart.Alignment.TopRight
legend1.Backdrop = New DataDynamics.ActiveReports.Chart.BackdropItem(Chart.Graphics _
	.BackdropStyle.Transparent, Color.Gray, Color.White, Chart.Graphics.GradientType _
	.Vertical, Drawing2D.HatchStyle.DottedGrid, Nothing, Chart.Graphics.PicturePutStyle _
	.Stretched)
legend1.Border = New DataDynamics.ActiveReports.Chart.Border(New Chart.Graphics.Line(Color _
	.Navy, 2), 0, Color.Black)
legend1.DockArea = Me.ChartControl1.ChartAreas(0)
legend1.LabelsFont = New DataDynamics.ActiveReports.Chart.FontInfo(Color.White, New System _
	.Drawing.Font("Arial", 9.0F))
legend1.Header = lHeader
legend1.MarginX = 5
legend1.MarginY = 5
Me.ChartControl1.Legends.Add(legend1)
' set the legend property of the series to the legend you created
Me.ChartControl1.Series(0).Legend = legend1
Me.ChartControl1.Series(1).Legend = legend1
Me.ChartControl1.Series(2).Legend = legend1
// C#
// create the legend and title for the legend
DataDynamics.ActiveReports.Chart.Legend legend1 = new DataDynamics.ActiveReports.Chart
	.Legend();
DataDynamics.ActiveReports.Chart.Title lHeader = new DataDynamics.ActiveReports.Chart
	.Title();
// set the properties for the legend title
lHeader.Backdrop = new DataDynamics.ActiveReports.Chart.Graphics.Backdrop(Chart.Graphics
	.BackdropStyle.Transparent, Color.White, Color.White, Chart.Graphics.GradientType
	.Vertical, System.Drawing.Drawing2D.HatchStyle.DottedGrid, null, Chart.Graphics
	.PicturePutStyle.Stretched);
lHeader.Border = new DataDynamics.ActiveReports.Chart.Border(new Chart.Graphics.Line(Color
	.White, 2, Chart.Graphics.LineStyle.None), 0, Color.Black);
lHeader.Font = new DataDynamics.ActiveReports.Chart.FontInfo(Color.White, new Font("Arial",
	10F, FontStyle.Bold));
lHeader.Text = "Series:";
// set the properties for the legend and add it to the legends collection
legend1.Alignment = DataDynamics.ActiveReports.Chart.Alignment.TopRight;
legend1.Backdrop = new DataDynamics.ActiveReports.Chart.BackdropItem(Chart.Graphics
	.BackdropStyle.Transparent, Color.Gray, Color.White, Chart.Graphics.GradientType
	.Vertical, System.Drawing.Drawing2D.HatchStyle.DottedGrid, null, Chart.Graphics
	.PicturePutStyle.Stretched);
legend1.Border = new DataDynamics.ActiveReports.Chart.Border(new Chart.Graphics.Line(Color
	.Navy, 2), 0, Color.Black);
legend1.DockArea = this.sharpGraph1.ChartAreas[0];
legend1.LabelsFont = new DataDynamics.ActiveReports.Chart.FontInfo(Color.White, new Font
	("Arial", 9F));
legend1.Header = lHeader;
legend1.MarginX = 5;
legend1.MarginY = 5;
this.ChartControl1.Legends.Add(legend1);

// set the legend property of the series to the legend you created
this.ChartControl1.Series[0].Legend = legend1;
this.ChartControl1.Series[1].Legend = legend1;
this.ChartControl1.Series[2].Legend = legend1;
Copyright © 2004-2005 Data Dynamics, Ltd. All rights reserved.