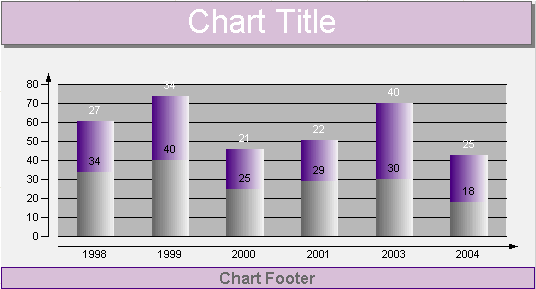
The Chart control allows you to add custom titles to your charts. The Titles collection is accessible from the SharpGraph object. With the ability to add as many titles as needed, dock them to any side of a chart area, change all of the font properties, add borders and shadows, make the background look the way you want it, and change the location of the text, you can easily make your titles look the way you want them to look.

The following code demonstrates creating header and footer titles, setting their properties, and adding them to the titles collection at run time.
' Visual Basic

' create the header and footer titles
Dim tHeader As New DataDynamics.ActiveReports.Chart.Title
Dim tFooter As New DataDynamics.ActiveReports.Chart.Title

' set the properties for the header
tHeader.Alignment = Chart.Alignment.Center
tHeader.Backdrop = New DataDynamics.ActiveReports.Chart.Graphics.Backdrop(System.Drawing _
	.Color.Thistle)
tHeader.Border = New DataDynamics.ActiveReports.Chart.Border(New DataDynamics.ActiveReports _
	.Chart.Graphics.Line(System.Drawing.Color.DimGray), 3)
tHeader.DockArea = Me.ChartControl1.ChartAreas(0)
tHeader.Docking = Chart.DockType.Top
tHeader.Font = New DataDynamics.ActiveReports.Chart.FontInfo(System.Drawing.Color.White, _
	New System.Drawing.Font("Arial", 25.0F))
tHeader.Text = "Chart Title"
tHeader.Visible = True

' set the properties for the footer
tFooter.Alignment = Chart.Alignment.Center
tFooter.Backdrop = New DataDynamics.ActiveReports.Chart.Graphics.Backdrop(System.Drawing _
	.Color.Thistle)
tFooter.Border = New DataDynamics.ActiveReports.Chart.Border(New DataDynamics.ActiveReports _
.Chart.Graphics.Line(System.Drawing.Color.Indigo), 0, System.Drawing.Color.Black)
tFooter.DockArea = Me.ChartControl1.ChartAreas(0)
tFooter.Docking = Chart.DockType.Bottom
tFooter.Font = New DataDynamics.ActiveReports.Chart.FontInfo(System.Drawing.Color.DimGray, _
	New System.Drawing.Font("Arial", 12.0F, System.Drawing.FontStyle.Bold))
tFooter.Text = "Chart Footer"
tFooter.Visible = True

' add the header and footer titles to the titles collection
Me.ChartControl1.Titles.AddRange(New DataDynamics.ActiveReports.Chart.Title() {tHeader, _
	tFooter})
// C#

// create the header and footer titles
DataDynamics.ActiveReports.Chart.Title tHeader = new DataDynamics.ActiveReports.Chart
	.Title();
DataDynamics.ActiveReports.Chart.Title tFooter = new DataDynamics.ActiveReports.Chart
	.Title();

// set the properties for the header
tHeader.Alignment = Chart.Alignment.Center;
tHeader.Backdrop = new DataDynamics.ActiveReports.Chart.Graphics.Backdrop(System.Drawing
	.Color.Thistle);
tHeader.Border = new DataDynamics.ActiveReports.Chart.Border(new DataDynamics.ActiveReports
	.Chart.Graphics.Line(System.Drawing.Color.DimGray), 3);
tHeader.DockArea = this.ChartControl1.ChartAreas[0];
tHeader.Docking = Chart.DockType.Top;
tHeader.Font = new DataDynamics.ActiveReports.Chart.FontInfo(System.Drawing.Color.White,
	new System.Drawing.Font("Arial", 25F));
tHeader.Text = "Chart Title";
tHeader.Visible = true;

// set the properties for the footer
tFooter.Alignment = Chart.Alignment.Center;
tFooter.Backdrop = new DataDynamics.ActiveReports.Chart.Graphics.Backdrop(System.Drawing
	.Color.Thistle);
tFooter.Border = new DataDynamics.ActiveReports.Chart.Border(new DataDynamics.ActiveReports
	.Chart.Graphics.Line(System.Drawing.Color.Indigo), 0, System.Drawing.Color.Black);
tFooter.DockArea = this.ChartControl1.ChartAreas[0];
tFooter.Docking = Chart.DockType.Bottom;
tFooter.Font = new DataDynamics.ActiveReports.Chart.FontInfo(System.Drawing.Color.DimGray,
	new System.Drawing.Font("Arial", 12F, System.Drawing.FontStyle.Bold));
tFooter.Text = "Chart Footer";
tFooter.Visible = true;

// add the header and footer titles to the titles collection
this.ChartControl1.Titles.AddRange(new DataDynamics.ActiveReports.Chart.Title[] {tHeader,
	tFooter});
Copyright © 2004-2005 Data Dynamics, Ltd. All rights reserved.