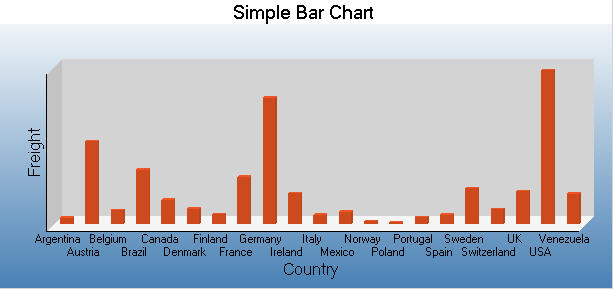
Bar charts are useful in comparing items across categories.
This walkthrough illustrates how to create a simple bar chart.
The walkthrough is split up into the following activities:
- Creating a new Visual Studio project
- Adding an ActiveReport to a Visual Studio project
- Adding a chart control to the report
- Setting a data source for the chart
- Setting the chart's properties
- Viewing the report
To complete the walkthrough, you must have access to the NorthWind database (Nwind.mdb).
When you have finished this walkthrough, you will have a report that looks similar to the following.

Creating a new Visual Studio project
To create a new Visual Studio project
- Open Visual Studio.
-
Click on File > New > Project.
- Select the project type and click on Windows Application.
- Change the name of your project and click OK.
Adding an ActiveReport to a Visual Studio project
To add an ActiveReport to your project
- Open a new project in Visual Studio.
- Click on Project > Add New Item.
- Select ActiveReports file and rename the file rptBarChart.
- Click Open.
Adding a chart control to the report
To add a chart control to the report
- Resize the section in which you want to place the chart.
- Click the Charting icon in the ActiveReports toolbox and draw it onto the report.
Setting a data source for the chart
To connect the data source to a database
- With the chart control highlighted, click the Data Source... hyperlink below the Properties Window. (If the hyperlink is not visible, right-click an empty space in the Properties Window and click Commands to check that option.) This brings up the Chart DataSource dialog box.
- Click Build...
- Select "Microsoft Jet 4.0 OLE DB Provider" and click Next >>.
- Click on the ellipsis to browse to Nwind.mdb. Click Open once you have selected the file.
- Click OK to continue.
- In the Query field, type "SELECT ShipCountry, SUM(Freight) AS Expr1 FROM Orders GROUP BY ShipCountry."
- Click OK to return to the report design surface.
Setting the chart's properties
To set the chart's properties
- With the chart control highlighted, click the Customize... hyperlink below the Properties Window. This brings up the Chart Designer dialog box.
- In the ChartAreas section which displays by default, click to expand the Axes.
- Click Axis X, and on the Common tab in the pane to the right, type Country in the Title textbox and increase the font size to 12.
- Choose the Labels tab in the pane on the right, and check the Staggered Labels option to avoid overlapping labels.
- Click Axis Y on the left, and on the Common tab in the pane to the right, type Freight in the Title textbox and increase the font size to 12.
- Click the Titles button on the left side of the Chart Designer.
- Type Simple Bar Chart in the Caption textbox on the header title, and increase the font size to 14.
- Click the footer title in the upper left corner of the dialog, and delete it.
- Click the Series button on the left side of the Chart Designer, and click Series1 to select it.
- In the Data Binding box, set X (Name) to ShipCountry, and set Y to Expr1.
- Delete Series2 and Series3.
- Click the Legend button on the left side of the Chart Designer.
- Uncheck the Visible checkbox at the top of the Common tab to hide the legend.
- Click the Finish button to exit the Chart Designer.
Viewing the report
To view the report
- Add the ActiveReports viewer control to a Windows Form.
- Add the code needed to set the viewer document equal to the report document. See Using the ActiveReports WinForm Viewer for help.
Copyright © 2004-2005 Data Dynamics, Ltd. All rights reserved.