Once you have grouped the data, it is often useful to compute aggregate values for the groups. For example, if you grouped sales data by country or product category, you may want to have the grid display the totals sales for each country and product category.
This is easy to accomplish using the C1FlexGrid. Simply set the GroupAggregate property on the columns that you want to aggregate, and the grid will automatically calculate and display the aggregates. The aggregates are automatically recalculated when the data changes.
Note that the aggregates are shown in the group header rows. For them to be visible, the grid’s AreGroupHeadersFrozen property must be set to false.
For example, consider the following grid definition:
<fg:C1FlexGrid x:Name="_flex" AutoGenerateColumns="False">
  <fg:C1FlexGrid.Columns>

    <fg:Column Header="Line" Binding="{Binding Line}" />
    <fg:Column Header="Color" Binding="{Binding Color}" />
    <fg:Column Header="Name" Binding="{Binding Name}" />

    <fg:Column Header="Price" Binding="{Binding Price}"
        Format="n2" HorizontalAlignment="Right" Width="*"/>
    <fg:Column Header="Cost" Binding="{Binding Cost}"
        Format="n2" HorizontalAlignment="Right" Width="*"/>
    <fg:Column Header="Weight" Binding="{Binding Weight}"
        Format="n2" HorizontalAlignment="Right" Width="*"/>
    <fg:Column Header="Volume" Binding="{Binding Volume}"
        Format="n2" HorizontalAlignment="Right" Width="*"/>
  </fg:C1FlexGrid.Columns>
</fg:C1FlexGrid>
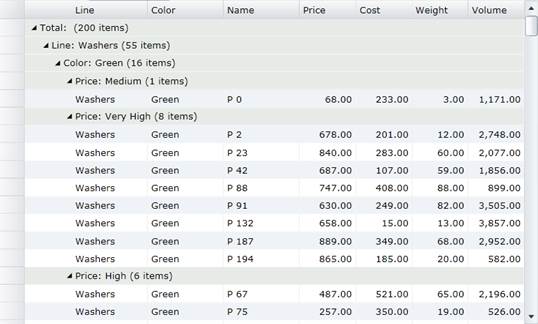
If you set the grid’s ItemsSource property to an ICollectionView object configured to group the data by “Line”, “Color”, and “Name”, you will get a grid that looks like this:
The grid shows the groups in a collapsible outline format and automatically displays the number of items in each group. This is similar to the view that would be displayed by the Microsoft DataGrid control.
The C1FlexGrid lets you go one step further and display aggregate values for the columns. For example, if you wanted to display totals for the “Price”, “Cost”, “Weight” and “Volume” columns, you would modify the XAML above as follows:
<fg:C1FlexGrid x:Name="_flex" AutoGenerateColumns="False"
    AreRowGroupHeadersFrozen="False"
  <fg:C1FlexGrid.Columns>

    <fg:Column Header="Line" Binding="{Binding Line}" />
    <fg:Column Header="Color" Binding="{Binding Color}" />
    <fg:Column Header="Name" Binding="{Binding Name}" />

    <fg:Column Header="Price" Binding="{Binding Price}"
        Format="n2" HorizontalAlignment="Right" Width="*"
        GroupAggregate="Sum"/>
    <fg:Column Header="Cost" Binding="{Binding Cost}"
        Format="n2" HorizontalAlignment="Right" Width="*"
        GroupAggregate="Sum"/>
    <fg:Column Header="Weight" Binding="{Binding Weight}"
        Format="n2" HorizontalAlignment="Right" Width="*"
        GroupAggregate="Sum"/>
    <fg:Column Header="Volume" Binding="{Binding Volume}"
        Format="n2" HorizontalAlignment="Right" Width="*"
        GroupAggregate="Sum"/>
  </fg:C1FlexGrid.Columns>
</fg:C1FlexGrid>
This XAML code contains two changes:
1) It sets the grid’s AreGroupHeadersFrozen to false. This is necessary because the group aggregates are shown in the group header rows, and if the headers are frozen then the aggregates will not be visible.
2) It sets the GroupAggregate property on several columns to “Sum”. This causes the grid to calculate and display the aggregate in the group header rows. Several aggregates are available, including “Sum”, “Average”, “Count”, “Minimum”, “Maximum”, etc.
After making this change, the grid will look like this:
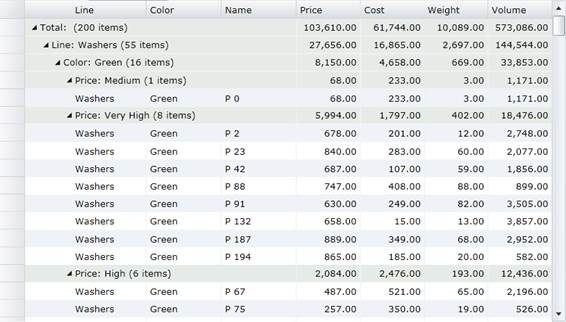
Notice how the group headers now display the aggregate value for the groups. The aggregate values are automatically recalculated when the data changes.