


 Hide All
The CPL Report Loader sample demonstrates how to customize the GrapeCity Unified ReportDesigner application by adding the TreeView control to the form to display a list of categorized reports. At runtime, you can double-click any report to load it into the designer.


<User Folder>\ComponentOne Samples\ActiveReports Developer 7\Page Reports\CPL\Layouts\VB.NET\CPLReportLoader
<User Folder>\ComponentOne Samples\ActiveReports Developer 7\Page Reports\CPL\Layouts\C#\CPLReportLoader
This report uses the Calendar control to display employee's vacations.
This report uses the List data region that groups data by Country. The report also contains the map image, which Value property is set to the expression with the MapCode data field from the XML data source.
It contains a hidden parameter that is used to accept the country ID. This report is called in other reports by drill-through links or as a subreport, so the country ID is passed silently. The default ID is the World country.
The dataset has a filter that retrieves only countries, specified by the report parameter.
By each textbox with category under Energy Production / Consumption you can see the Image control that uses the Icon Set function to flag energy categories where consumption is greater than production.
 LifeExpectancyByGdpAndMedianAge.rdlx
This report uses the List and Table data regions that group data by CustomerID and SaleID respectively to display order information. The SalesAmount textbox of the Table has its Value property set to Sum function to calculate the total for each order (as a table group subtotal). The YearTotal textbox of the Table has its Value property set to Sum function to calculate the total with tax for each order as well as the grand total of pre-tax sales.
The Reels logo that is displayed on the report is embedded within the Reels theme.
The page number in the PageHeader section is reset every time a new customer is displayed.
This report demonstrates how to create a coupon where the amount of coupons is determined by the report parameter.
The Reels logo displayed on the report is embedded within the Reels theme.
This report uses the Chart and Matrix data regions to display the number of sold items and the profit for each month of the two year span (2004-2005) for the selected district.
The report parameter determines what district to display and uses the available values from the second report dataset SalesData.
The Reels logo that is displayed on the report is embedded within the Reels theme.
The StoreName textbox in the report Body uses the drill-through link (the Action is set to Jump to report) that opens the StoreReport.rdlx with more information.
This report uses the BandedList data region that groups data by SaleYear, DistrictID and RegionID to display district sales details.
The Reels logo that is displayed on the report is embedded within the Reels theme.
This report uses the nested List data regions that group data by MovieID and MoviePersonID to return a distinct number of movies with the selected actor(s).
The report contains two cascading parameters that narrow down the number of actors displayed in the list.
The Reels logo that is displayed on the report is embedded within the Reels theme.
This report uses the Matrix data region to display the units sold for each genre, each year and each quarter. The report also uses the plain column Chart to display the number of titles sold for each genre.
This report uses the multivalue parameter that allows you to select more than one genre for displaying sales data.
The Reels logo that is displayed on the report is embedded within the Reels theme.
This report uses the Median and Mode aggregate functions to show the middle value in a set of data as well as the most commonly occurring value.
It also uses the ReelsConfidential.rdlx-master report to provide standard page headers and footers.
This report uses the Table data region that groups data by District. The Textbox controls in the Table have their Value property set to expressions to display the total of sales for each district and region as well as the totals of all districts within a region for a given month.
It also uses the Plain Line Chart with the data grouped and sorted by Day for each SaleDate to display sales and profit for the selected month.
This report uses query based parameters to select the month and region for displaying data.
The Reels logo that is displayed on the report is embedded within the Reels theme.
This report uses four List data regions with groupings. The MovieList is grouped by MovieID, the GenreList is used to display the genre names and is grouped by GenreID, the CrewList is used to display the title and is grouped by CrewTitleID, and finally the CastNameList is used to display the cast and crew and is grouped by MoviePersonID.
This report uses cascading parameters. The first parameter asks to select which letter the movie titles starts with, and then the second parameter asks to select a movie to display.
The CrewName textbox in the report Body report Body uses the drill-through link (the Action is set to Jump to report) that opens the Filmography.rdlx with more information on the selected person. The parameters of this report are passed to the Filmography.rdlx report.
The Reels logo that is displayed on the report is embedded within the Reels theme.
This master report is a template for other reports. This master report provides the connection to the Reels data source that child reports can use.
The Reels logo that is displayed on the report is embedded within the Reels theme.
This report uses the Table data region to display data. The Table uses the Region value to group the report data and the SalesAmount value to sort the report data. It also uses filtering to filter the report data by the RegionID value. The Sum Textbox controls in the Table have their Value properties set to expressions to display the total of sales amount for each region.
The Reels logo that is displayed on the report is embedded within the Reels theme.
This report uses the Table data region without grouping. The Table detail row has its BackgroundColor property set to the expression to create a green bar report.
The Reels logo that is displayed on the report is embedded within the Reels theme.
This report uses the List data region to display data. The List data is grouped by Image.
The List contains the Table data region that groups its data byMediaID.
The report also contains the Plain Column Chart to display sales and profit by media type and embedded images.
This report uses the ReelsConfidential.rdlx-master report to render the report page header and footer.
This report uses the Matrix data region and subtotals to display the number of units sold and profit for each region by year and quarter. The Matrix report data has the row grouping by Region and the column grouping by SaleDate.Year.
The report also uses the Plain Column Chart to display the annual profit for each region. Data in the Chart is also grouped by Region and SaleDate.Year.
The image in the report PageHeader uses the embedded images from a local image folder.
This report uses the Table data region and three Container controls nested in the List data region. The List is grouped by SaleID to produce the body of the receipt. The salesTaxLabel and totalSalesTax textboxes use the Sum function that totals the amount due in the list and adds tax to the sum of a field for the grand total due.
The Reels logo that is displayed on the report is embedded within the Reels theme.
This report uses the Table and Chart data regions to display totals of sales and profit for the selected date range. The Table also uses the DataBar function to plot the profits.
The Chart and Table data is grouped by Month and Year. The Month textbox uses the drill through link to display MonthlySalesReport.rdlx with more information on the selected month.
This report uses parameters that allow the null value to select the range of dates.
The Reels logo that is displayed on the report is embedded within the Reels theme.
This report identifies stores with profits above or below expectations. The report has two Image controls that display the database images and use the IconSet function.
This report uses the ReelsConfidential.rdlx-master report to render page headers and footers.
This report uses the Table and Chart data regions to display sales and profit for each employee.
The Table and Chart data is grouped by EmployeeID. The Table uses the hierarchical grouping to show the relationship between employee and supervisor for each store. The FirstName textbox has its Padding> Left property set to the Level function that leaves space of 15 pixels wide to the left of the control.
This is the drill-down report where the Visibility > Hidden property of the Table detail row is set to =Fields!Supervisor.Value <> 0 and the Visibility > ToggleItem property is set to the FirstName data field. The expression in the Visibility > Hidden property calculates whether the supervisor field returns 0, so only the supervisor's name is initially displayed. By clicking the toggle image next to the supervisor's name, the rows with details about employees are displayed.
The report uses the cascade of parameter values - Region, District and StoreNumber. Each parameter depends on the value of the previous parameter and each comes from a separate dataset.
The Reels logo that is displayed on the report is embedded within the Reels theme.
This report uses two Table data regions to display the top and bottom performers based on the movies sales. Each Table data is grouped by MoviePersonID and MovieID (nested grouping).
The TopN filter is applied to one table and the BottomN filter is applied to another. The number of items returned by each of the filters are specified in report parameters.
This report also uses two integer parameters to alter the number of items displayed in each table. The parameters use default values, which are passed to textboxes of the Table Headers.
This is the drill-down report where the second Table Group Header in each Table has its Visibility > Hidden property set to True and the ToggleItem property set to to the PerformerName textbox. By clicking the toggle image next to the name, the rows containing details about performers are displayed.
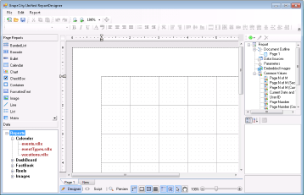
This is the main form that appears when you run this sample. This form uses the ToolStripPanel, ToolStripContentPanel, Designer, Toolbox, ReportExplorer, TreeView and PropertyGrid controls to create a customized Unified ReportDesigner.
Right-click the form and select View Code to see how to set the designer and create a blank page report. It also contains code that attaches the Toolbox, ReportExplorer and PropertyGrid controls to the Designer, inserts DropDown items to the ToolStripDropDownItem and sets their functions. Finally, it also contains code that adds the reports to the TreeView control, loads a report into the Designer when the report is double-clicked, and checks for any modifications that have been made to the report in the designer.