


 Show All
 Hide All
The FPL Report Loader sample demonstrates how to customize the End User Designer application by adding the TreeView control on the form to display a list of categorized reports. At runtime, the user can double-click any report to load it into the designer.


<User Folder>\ComponentOne Samples\ActiveReports Developer 7\Page Reports\FPL\Layout\VB.NET\FPLReportLoader
<User Folder>\ComponentOne Samples\ActiveReports Developer 7\Page Reports\FPL\Layout\C#\FPLReportLoader
This folder contains several subfolders that are categorized according to the report type.
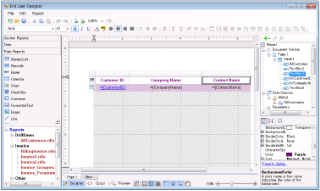
AllCustomers report: This report uses the NWind shared data source connection to provide data. This report uses the Table data region to display customer's contact details. The Textbox displaying the CustomerID field in the detail row of the Table is used to set a drill-through link to navigate to the CustomerDetails report.
CustomerDetails report: This report uses the NWind shared data source connection to provide data. This report is used as a child report for AllCustomers report that appears at runtime. It uses the Table data region to display the customer orders in the past. It gets displayed when the user clicks any CustomerID link in the AllCustomers report. The Textbox displaying the OrderID field in the detail row of the Table is used to set a drill-through link to navigate to the OrderDetails report.
OrderDetails report: This report uses the NWind shared data source connection to provide data. This report is used as a child report for CustomerDetails report. It uses the Table data region to display order details for the OrderID value when the OrderID link in the CustomerDetails report is clicked.
BillingInvoice report: This report uses the NWind shared data source connection to provide data. This report showcases a billing invoice layout commonly used in convenience stores. The report mostly contains Label, TextBox and Line controls in its layout. The EAN128FNC1 barcode is used in this report due to its high reading accuracy in convenience stores.
Invoice_Grouped report: This report uses the NWind shared data source connection to provide data. This report uses the Table, few TextBox and Label controls to display customer transactions in the Invoice format. The page is grouped on the CustomerID field, therefore all transactions made by a customer appear together.
Invoice_Parameters report: This report uses the NWind shared data source connection and two datasets to provide data. This report is similar to the Invoice_Grouped report with an additional feature of parameters. This report uses parameters set on the CustomerID field to filter data at report preview.
Invoice1 report: This report uses the NWind shared data source connection to provide data. This report uses a BandedList and few TextBox controls to create the Invoice layout for displaying customer transactions. Both page and the BandedList control are grouped by the OrderID field. One of the texboxes in the footer section of the BandedList control uses the Sum function to display the GrandTotal of all transactions.
Invoice2 report: This report uses the NWind shared data source connection to provide data. This report uses a Table, few TextBoxes and Shape controls to create the Invoice layout for displaying customer transactions. The report page is grouped by the CustomerID field, therefore all transactions made by a customer appear together. One of the textboxes placed inside the Container control at the bottom of the report uses the Sum function to display the GrandTotal of all transactions.
Catalog report: This report uses the NWind shared data source connection to provide data. This report uses multiple page layouts to create a catalog. The layout of this report is spread over to four pages, which appear one after another at runtime. Page1 and Page2 layouts simply contain Image and Textbox controls for displaying introductive text. The layout on Page3 contains a List data region with TextBox controls and a Table to display product details for each product category. The List is grouped by the CategoryID field to filter products by their category and its FixedSize property is set to fit in excessive data. The layout on Page4 uses Textbox, Shape and Line controls to create a Order Form, which a user is to fill manually.
CellMerging report: This report uses the NWind shared data source connection to provide data. This report demonstrates cell merging in a Matrix data region, where cells with same values are merged automatically to delete duplicate values.
DeliverySlip_theme.rdlx: This report uses the Seikyu2 shared data source connection to provide data. This report uses TextBox, Labels, Container controls and two Table data regions to display the invoice information. The report uses two themes and has its CollateBy property set to ValueIndex to determine the order in which the report pages are rendered. Some TextBox controls on the report also use the Sum function to display the total price information for each Invoice. The page is grouped on the EstimateID field, therefore the invoices are sorted by EstimateID.
EmployeeSales report: This report uses the NWind shared data source connection to provide data. This report uses the Chart and the Table data regions to display sales by each employee for the year of 1997. The Chart uses the Column chart to display a graphical analysis of sales by each employee; the Table lists down the exact numbers. One of the TextBox controls on the report also uses the Sum function to display the grand total of all sales.
IRS-W4 report: This report uses the IRS XML data source to provide data to the report. This report uses Textbox, CheckBox, Shape and Line controls to create a simple layout of a form that is used for banking purposes.
Letter report: This report uses the NWind shared data source connection to provide data. This report uses an Image, FormattedTextBox, Table and an OverflowPlaceholder controls to create a layout for a letter. The FormattedTextBox control uses text with HTML tags to display content. The Table displays order ids with order dates and order amount and is linked with the OverflowPlaceholder control to display excessive data on the same page. The Reels logo, displayed on the report inside the Image control, is embedded within the Reels theme and the TextBox placed below the Image control uses the Global field to display the current date. The layout page is grouped by the CustomerID field to filter data on each report page according to individual customers.
MatrixSample.rdlx: This report uses the NWind shared data source connection to provide data. This report uses the Matrix data region to display an orders report for category name and product name by year and quarter with the totals information. The Matrix uses the multiple row grouping to group matrix data by CategoryName and ProductName, and the multiple column grouping to group matrix data by Years and Quarter. One of the TextBox controls on the report also uses the Sum function to display the grand total of order amount.
PurchaseReport report: This report uses the NWind shared data source connection to provide data. This report uses Textbox and Table controls to display purchase details of each company. The layout page is grouped by the CompanyName field to filter data on each report page according to each company. The Textbox control placed below each table column uses the Sum function to display total for each table column. The FixedSize property of the Table is set to fit in excessive data.
ReelsMatrix.rdlx: This report uses the Reels shared data source connection to provide data. It contains the Matrix data region to display a sales report for each country, city and media type by year with the totals information. The Matrix uses the multiple row grouping to group matrix data by Country, City and MediaType, and the column grouping to group matrix data by Years. One of the TextBox controls on the report also uses the Sum function to display the grand total of all orders.
SalesReport report: This report uses the Reels OleDb data source connection and two datasets that fetch data by the Stored Procedure query. The layout of the report uses the Chart to display sales and profit for the selected date range and the Table to display chart data. The Table uses the Detail grouping by EmployeeID to provide totals of the sales and profit for the selected date range. It also uses the DataBar function to plot the profits. The Reels logo, displayed on the report inside the Image control, is embedded within the Reels theme. This report also uses two nullable parameters to select the range of dates.
TackSeal.rdlx: This report uses the NWind shared data source connection to provide data. It contains the OverflowPlaceHolder controls and the List data region to create a columnar display of tack seals with postal barcodes. The List data region has its OverflowName property set to OverflowPlaceHolder1 and the OverflowPlaceHolder1 control has its its OverflowName property set to OverflowPlaceHolder2 to assure the sequence of the data columnar display within the report page.
This is the main form that appears when you run this sample. This form uses a ToolStripPanel, ToolStripContentPanel, Designer, Toolbox, ReportExplorer, TreeView and a PropertyGrid control to build a customized End User Designer.
The code-behind of the form contains code that sets the designer and creates a blank page based report. It also contains code that attaches the Toolbox, ReportExplorer and PropertyGrid controls to the Designer, inserts DropDown items to the ToolStripDropDownItem and sets their functions, adds the reports to the TreeView control and loads a report in the designer when double-clicked and checks for any modifications that have been made to the report loaded in the designer.