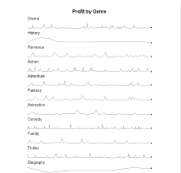
Applying detail grouping to a sparkline helps to visualize data clearly – the sparkline value is displayed as a set of sparklines grouped by a detail grouping value. The following steps take you through how to show trends in analyzed data when detail grouping is set with Sparklines.
These steps assume that you have already added a Page Report template to your project, connected it to a data source and added a dataset. See Adding an ActiveReport to a Project, Connect to a Data Source and Add a Dataset for more information.
 |
Note: This topic uses examples from the SalesByGenre table in the Reels database. By default, in ActiveReports Developer, the Reels.mdb file is located in the [User Documents folder]\ComponentOne Samples\ActiveReports Developer 7\Data folder. |
- From the toolbox, drag a Table data region onto the report design surface.
- With the table selected, set the following:
- Set the DataSetName property (For example, SalesByGenre).
- Right-click the table handle to the left of the Detail row and select Insert Row Below or Insert Row Above from the menu and add another detail row to the table.
- Hover your mouse over the first Textbox located in the Detail row column to make the Field Selection Adorner appear. Click this adorner to display a list of available fields from the data set, select a field (For example, GenreName).

Note: This automatically places an expression in the detail row and simultaneously places a static label Genre Name in the header row of the same column.
- From the toolbox, drag a Sparkline control to the second detail row of the table on your report and set the following in the Properties Window.
- Set the SparklineType property to Line (by default).
- Set the DataSetName property to a data set (For example, SalesByGenre).
- Set the SeriesValue property by selecting <Expression...>. In the Expression Editor under Fields, expand the Fields (SalesByGenre) node and select a numeric field from the connected data set (for example, =Fields!Profit.Value). Click the OK button to accept the change.
- Set the LineColor property to Gray.
- Set the MarkerColor property to Blue.
- To apply the detail grouping to the sparkline, right-click the Table data region and go to Properties Window to select the Properties dialog command at the bottom.
- In the Table dialog that appears, select the Detail Grouping.
- In the General tab, under Group on, select an expression from the drop-down list on which to group the data (for example, =Fields!GenreName.Value).
- Click the OK button to close the dialog and save the changes.
- Go to the preview tab to view the sparkline you have added to your report.
This set of sparklines display the profit value grouped by the movie genres.


