ActiveReports Developer contains many new features along with the popular ActiveReports engine and report viewers, plus the powerful Data Dynamics Reports designer.
New Page Layout
In the new Page layout, you can design reports at the page level without any banded sections. This lets you place controls anywhere on the report. This layout has two variations, Continuous Page Layout (CPL) and Fixed Page Layout (FPL). In a CPL report, controls grow vertically to accommodate data. In an FPL report, controls do not change in size based on the data, but you can use an OverflowPlaceHolder to handle any extra data. For more information, see FPL Page Report and CPL Page Report.
- Interactive report options include drill-down links, bookmark links, hyperlinks, document maps, sorting, and filtering. Users can benefit from these features when viewing reports at run-time.
- Shared data source refers to a file in RDSX format that contains data connection information. RDSX (Report Data Source XML) is a proprietary file format that functions as a reusable data source for a single report or multiple reports.
- Data regions are report controls that can contain other report controls that repeat for every row of data. Report controls that function as data regions are Table, List, BandedList, Matrix and Chart.
- OverflowPlaceHolder is a rectangular placeholder control. When you use a List, BandedList, Matrix or Table data region on an FPL report, data regions cannot grow, so you can specify an OverflowPlaceHolder control to catch the overflow.
- Theme Editor allows you to create themes by setting colors, fonts, images, and constant expressions that you save to an .rdlx-theme file. You can add one or more themes to a report. If a report has multiple themes, you can set up collation to control the page order.
- Expression Editor allows you to use an expression to set the value of a control, or set conditions under which certain styles apply. You can enter Microsoft Visual Basic® .NET expressions in many properties using the Properties Window or the Expression Editor Dialog.
- Data Visualizer has several ways to display data in easy-to-comprehend formats that are small enough to use in line with text in the report. You can open the Data Visualizer dialog within the Image or BackgroundImage properties of the Image and TextBox report controls.
Learn More | Report Types | Shared Data Source | Page Report Toolbox | OverflowPlaceHolder | Themes | Expressions | Single Layout Reports | Overflow Data in a Single Page | Overflow Data in Multiple Pages
Excel Improvements
- The Excel export filter now supports Excel 2007.
- New page settings features include Orientation and PaperSize.
- New security features include Password, ProtectedBy, ReadOnlyRecommended, and WritePassword.
Barcodes
- New barcode types include DataMatrix, Matrix_2_of_5, and IntelligentMail.
- The new NWRatio property allows you to modify the ratio between narrow and broad bars for some barcode types.
- New QuietZone, CaptionGrouping, and Rotation properties.
- Enhancements to barcodes include encoding enhancement in QRCode and caption separation capability in EAN/UPC.
New Designer
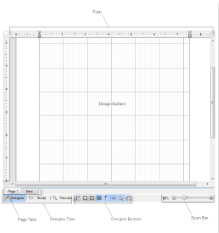
Designer buttons located to the right of the designer tabs along the bottom of the designer provide fast access to layout guides.

-
Snap Lines mode aligns the control you are dragging with other controls on the report design surface. When you drag the control around, snap lines appear when it is aligned with other controls or with the edges of the report or section, and when you drop it, it snaps into place in perfect alignment.
-
Snap to Grid mode aligns the control you are dragging with grid lines on the report design surface. When you drop the control, it snaps into place in alignment with the nearest grid mark. To place your controls freely on the report design surface, turn this setting off.
- Excel-like auto scrolling works in 4 directions, top, bottom, left and right. This option is very useful when you drag a control beyond the visible area of the report design surface. The report scrolls in the direction you drag the mouse until it reaches the edge of the design surface.
- Pan Mode has a hand cursor that lets you navigate through your report by clicking the left mouse button and dragging the report to the desired position.
- Dimension lines appear during a drag operation, and run from the borders of the report control or data region being moved or resized to the edges of the report design surface. Dimension lines let you track the location of the control as you move it by displaying the distance between the control and the edge of the writable area of the report.
- Report control dialogs offer an easy way to set relevant properties on report controls.
Learn More | Designer Buttons | Snap Lines
Windows Forms Viewer
- Selection mode allows users to select contents of the report, including partial text selection.
- Snapshot mode allows users to select areas of the report to copy and paste as an image into any application that accepts pasted images.
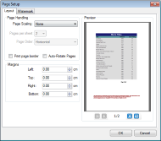
- Page Setup dialog allows users to change page scaling, set page margins and add a watermark when printing a report.
- Parameters pane allows users to select parameters for reports. It shows up automatically for reports with parameters.
Learn More | Use Advanced Printing Options
WebViewer (HTML Type)
- Web Viewer is now AJAX-based and no longer requires PostBack. For example, Go to Previous page and Go to Next page buttons in the HTML viewer work via Web service and no longer require PostBack.
- Parameters pane allows users to select parameters for reports. To show or hide the Parameters pane in the sidebar, click the Toggle Sidebar button in the viewer toolbar.
Learn More | Using the HTML Viewer
Silverlight Viewer
The Silverlight viewer also has a Parameters pane that allows users to select parameters for reports. To show or hide the Parameters pane in the sidebar, click the Toggle Sidebar button in the Toolbar.
Learn More | Using the Silverlight Viewer
WPF Viewer
The WPF viewer is a custom control that allows to view both section and page report layouts. It contains a toolbar and a sidebar with Thumbnails, Search results, Document map and Parameters panes.
You can use annotations when working with a report in the WPF Viewer and add notes or images directly to the reports.
Learn More | Using the WPF Viewer
PDF/A Support
ActiveReports PDF export filter and PDF rendering extension (Page Layout) provide the PDF/A support that includes versions such as PdfA1a, PdfA1b, PdfA2a, PdfA2b, or PdfA2u.
Getting Started
Getting Started
Adding an ActiveReport to a Project
How To
How To
Concepts
Concepts
Walkthroughs
Samples and Walkthroughs


