Creating the View in Code
First, let’s add some member variables to the CustomUI class to keep track of the underlying Silverlight controls:
C1OlapPanel _olapPanel; // created in code
C1OlapGrid _olapGrid; // custom control in designer
C1OlapChart _olapChart; // custom control in designer
bool _loaded = false; // true if screen data is available
In this sample we will create an instance of C1OlapPanel in the screen’s Created method. In previous examples the C1OlapPanel part is visible to the end-user. But in this sample we use it behind-the scenes, so users won’t ever see it. This invisible control is used as a data source for the grid and the chart, and is responsible for filtering and summarizing the data. Both the grid and the chart have their DataSource property set to the C1OlapPanel.
partial void CustomUI_Created()
{
// create hidden olap panel on UI thread
Dispatchers.Main.BeginInvoke(() =>
{
_olapPanel = new C1OlapPanel();
_olapPanel.ShowZeros = false;
});
// wait for olap grid to become available
IContentItemProxy gridProxy = this.FindControl("OlapGrid");
gridProxy.ControlAvailable += new EventHandler<ControlAvailableEventArgs>(gridProxy_ControlAvailable);
// wait for olap chart to become available
IContentItemProxy chartProxy = this.FindControl("OlapChart");
chartProxy.ControlAvailable += new EventHandler<ControlAvailableEventArgs>(chartProxy_ControlAvailable);
}
Note that we must create the C1OlapPanel on the UI thread. Next, we set up proxies for the C1OlapGrid and C1OlapChart controls added to the screen in the designer. We can only access the controls themselves when the corresponding ControlAvailable event handler fires.
void gridProxy_ControlAvailable(object sender, ControlAvailableEventArgs e)
{
// bind grid to olap panel
_olapGrid = e.Control as C1OlapGrid;
_olapGrid.DataSource = _olapPanel;
_olapGrid.SortedColumn += delegate { _olapChart.UpdateChart(); };
Bind();
}
void chartProxy_ControlAvailable(object sender, ControlAvailableEventArgs e)
{
// bind chart to olap panel
_olapChart = e.Control as C1OlapChart;
_olapChart.DataSource = _olapPanel;
Bind();
}
In each case, we set the DataSource property of the control to the C1OlapPanel instance created earlier. For the grid, we also handle the SortedColumn event to keep the chart in sync whenever the user changes the sort order by clicking a grid column header.
Since we need to pass the screen’s data (the Invoices collection) to the C1OlapPanel for analysis, we use the Loaded method to receive notification that the data was successfully loaded (or not).
partial void Invoices_Loaded(bool succeeded)
{
_loaded = succeeded;
Bind();
}
The following helper functions are used to initialize (and modify) the OLAP view definition:
bool CanBind()
{
return _loaded && _olapGrid != null && _olapChart != null;
}
void Bind()
{
ViewBy("Country");
}
void ViewBy(string fieldName)
{
if (CanBind())
{
Dispatchers.Main.BeginInvoke(() =>
{
if (_olapPanel.DataSource == null)
{
_olapPanel.DataSource = this.Invoices;
}
BuildView(fieldName);
});
}
}
CanBind returns true if all preconditions have been met; that is, if the Silverlight controls specified in the designer are ready and the Invoices collection has been loaded successfully. Bind is used in several places to set the initial view definition. The code is written so that no assumptions are made about the order in which the preconditions are satisfied. The ViewBy helper method ensures proper threading and performs a one-time assignment of the Invoices collection to the C1OlapPanel control.
The BuildView helper method configures the OLAP field collections. The string argument determines the row field:
void BuildView(string fieldName)
{
// get olap engine
var olap = _olapPanel.OlapEngine;
// stop updating until done
olap.BeginUpdate();
// clear all fields
olap.RowFields.Clear();
olap.ColumnFields.Clear();
olap.ValueFields.Clear();
// format order dates to group by year
var f = olap.Fields["OrderDate"];
f.Format = "yyyy";
f.Caption = "Year";
// rename value field
olap.Fields["ExtendedPrice"].Caption = "Sales";
// build up view
olap.ColumnFields.Add("OrderDate");
olap.RowFields.Add(fieldName);
olap.ValueFields.Add("ExtendedPrice");
// restore updates
olap.EndUpdate();
}
The BuildView method gets a reference to the C1OlapEngine object provided by the C1OlapPanel and immediately calls the BeginUpdate method to stop updates until the new view has been completely defined. This is done to improve performance.
The code then sets the format of the “OrderDate” field to “yyyy” so that sales are grouped by year. It rebuilds the view by clearing the engine’s RowFields, ColumnFields, and ValueFields collections, then adding the fields that should be displayed. The “fieldName” parameter passed by the caller contains the name of the only field that changes between views in this example. When all of this is done, the code calls EndUpdate so the C1OlapPanel will update the output table.
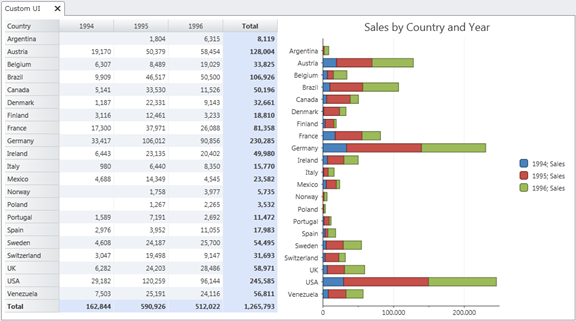
At this point, the code is sufficient to display a grid with countries (rows) and years (columns), along with a bar chart that plots the same values.
In the next step, we will add LightSwitch buttons to the screen command bar for switching and filtering OLAP views.
