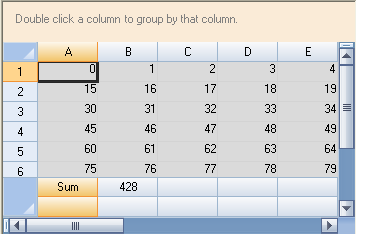
You can show a column footer or a group footer or both for the sheet and put information in the footer such as formulas or text. The column footer is an area at the bottom of the sheet. The group footer is an extra row of footer cells at the bottom of a sheet with grouping, if you are using the grouping feature.
For details on the API, refer to the ColumnFooter property of the SheetView class and the various members of the ColumnFooter class.
In order to calculate the column footer or group footer result with a formula, set the SetAggregationType method of the ColumnFooter object to the correct formula type for that column. The following figure displays a column footer with a formula in the column:

The group footer is an extra row that is displayed below the group after grouping by a column header. The GroupFooterVisible property must be set to true after the group has been created. The Grouped event can be used to put information in the group footer after a user has created the group.
For more information on column appearance, refer to Customizing the Row or Column Appearance.
For more information on grouping, refer to Managing Grouping of Rows of User Data.
Properties Window
- At design time, in the Properties window, select the Sheets property for the FpSpread component.
- Click the button to display the SheetView Collection Editor.
- Select the ColumnFooter property or the GroupFooter property or both in the Property list and set visible to true.
- Click OK to close the editor.
Using a Shortcut
Set the Visible property of the ColumnFooter for the sheet.
Example
This example code displays a column footer and sets a span and a text color.
| C# |  Copy Code Copy Code |
|---|---|
fpSpread1.Sheets[0].RowCount = 10; fpSpread1.Sheets[0].ColumnCount = 15; // Show the column footer. fpSpread1.Sheets[0].ColumnFooter.Visible = true; fpSpread1.Sheets[0].ColumnFooter.RowCount = 2; fpSpread1.Sheets[0].ColumnFooter.DefaultStyle.ForeColor = Color.Purple; fpSpread1.Sheets[0].ColumnFooter.Columns[12].HorizontalAlignment = FarPoint.Win.Spread.CellHorizontalAlignment.Left; fpSpread1.Sheets[0].ColumnFooter.Cells[0, 12].RowSpan = 2; fpSpread1.Sheets[0].ColumnFooter.Cells[0, 0].Value = "test"; |
|
| VB |  Copy Code Copy Code |
|---|---|
FpSpread1.Sheets(0).RowCount = 10 FpSpread1.Sheets(0).ColumnCount = 15 ' Show the footer. FpSpread1.Sheets(0).ColumnFooter.Visible = true FpSpread1.Sheets(0).ColumnFooter.RowCount = 2 FpSpread1.Sheets(0).ColumnFooter.DefaultStyle.ForeColor = Color.Purple FpSpread1.Sheets(0).ColumnFooter.Columns(12).HorizontalAlignment = FarPoint.Win.Spread.CellHorizontalAlignment.Left FpSpread1.Sheets(0).ColumnFooter.Cells(0, 12).RowSpan = 2 FpSpread1.Sheets(0).ColumnFooter.Cells(0, 0).Value = "test |
|
Using a Shortcut
Set the SetAggregationType method for the column.
Example
This example sums the values in the first column and displays them in the column footer. The example also sums the values in the second group and puts them in the group footer.
| C# |  Copy Code Copy Code |
|---|---|
FpSpread1.Sheets[0].RowCount=8; FpSpread1.Sheets[0].ColumnCount = 15; fpSpread1.Sheets[0].GroupBarInfo.Visible = true; fpSpread1.Sheets[0].AllowGroup = true; fpSpread1.Sheets[0].GroupFooterVisible = true; fpSpread1.Sheets[0].ColumnFooter.Visible = true; fpSpread1.Sheets[0].ColumnFooter.RowCount = 2; fpSpread1.Sheets[0].ColumnFooter.Columns[12].HorizontalAlignment = FarPoint.Win.Spread.CellHorizontalAlignment.Left; fpSpread1.Sheets[0].ColumnFooter.Cells[0, 12].RowSpan = 2; //Value for (int r = 0; r < fpSpread1.Sheets[0].RowCount; r++) { for (int j = 0; j < fpSpread1.Sheets[0].ColumnCount; j++) { fpSpread1.Sheets[0].Models.Data.SetValue(r, j, j + r * fpSpread1.Sheets[0].ColumnCount); } } int i = 0; fpSpread1.Sheets[0].ColumnFooter.SetAggregationType(0,1, FarPoint.Win.Spread.Model.AggregationType.Sum); fpSpread1.Sheets[0].ColumnFooter.Cells[0, i].Value = "Sum"; private void fpSpread1_Grouped(object sender, EventArgs e) FarPoint.Win.Spread.Model.GroupDataModel gdm; gdm = (FarPoint.Win.Spread.Model.GroupDataModel)fpSpread1.ActiveSheet.Models.Data; gdm.GroupFooterVisible = true; FarPoint.Win.Spread.Model.Group g1 = (FarPoint.Win.Spread.Model.Group)gdm.Groups[1]; ((FarPoint.Win.Spread.Model.IAggregationSupport)g1.GroupFooter.DataModel).SetCellAggregationType(0, 0, FarPoint.Win.Spread.Model.AggregationType.Sum); fpSpread1.ActiveSheet.Models.Data = gdm; } |
|
| VB |  Copy Code Copy Code |
|---|---|
FpSpread1.Sheets(0).RowCount = 8 FpSpread1.Sheets(0).ColumnCount = 15 FpSpread1.Sheets(0).GroupBarInfo.Visible = True FpSpread1.Sheets(0).AllowGroup = True FpSpread1.Sheets(0).GroupFooterVisible = True FpSpread1.Sheets(0).ColumnFooter.Visible = True FpSpread1.Sheets(0).ColumnFooter.RowCount = 2 fpSpread1.Sheets(0).ColumnFooter.Columns(12).HorizontalAlignment = FarPoint.Win.Spread.CellHorizontalAlignment.Left 'Value Dim r As Integer Dim j As Integer For r = 0 To FpSpread1.Sheets(0).RowCount For j = 0 To FpSpread1.Sheets(0).ColumnCount FpSpread1.Sheets(0).Models.Data.SetValue(r, j, j + r * FpSpread1.Sheets(0).ColumnCount) Next j Next r Dim i As Integer i = 0 FpSpread1.Sheets(0).ColumnFooter.SetAggregationType(0, 1, FarPoint.Win.Spread.Model.AggregationType.Sum) FpSpread1.Sheets(0).ColumnFooter.Cells(0, i).Value = "Sum" Private Sub FpSpread1_Grouped(ByVal sender As Object, ByVal e As System.EventArgs) Handles FpSpread1.Grouped Dim gdm As FarPoint.Win.Spread.Model.GroupDataModel Dim g1 As FarPoint.Win.Spread.Model.Group gdm = FpSpread1.Sheets(0).Models.Data gdm.GroupFooterVisible = True g1 = gdm.Groups(1) CType(g1.GroupFooter.DataModel, FarPoint.Win.Spread.Model.IAggregationSupport).SetCellAggregationType(0, 0, FarPoint.Win.Spread.Model.AggregationType.Sum) FpSpread1.ActiveSheet.Models.Data = gdm End Sub |
|


