You can customize the appearance of the outline (range group) using properties on the SheetView class or in an interface renderer.
The two properties in the SheetView class that can be used to customize the appearance are:
You can also use an EnhancedInterfaceRenderer to customize the appearance. The properties include:
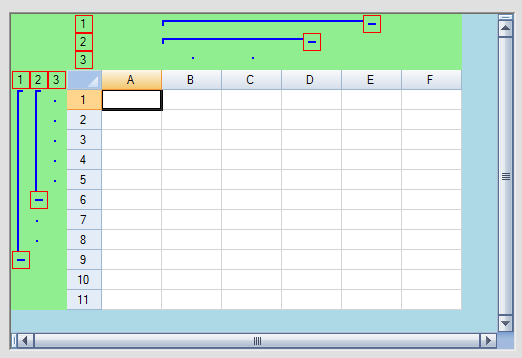
The line color also sets the color of the points in the outline. The following figure shows the results of the example code below where several of these properties are set.

Notice that the outline background is different from the gray area of the spreadsheet.
Using Code
Use the interface renderer to provide a custom look to outlines.
Example
This example creates an outline in the rows and in the columns and changes various colors. The result is shown in the figure above.
| C# |  Copy Code Copy Code |
|---|---|
fpSpread1.ActiveSheet.Rows.Count = 11;fpSpread1.ActiveSheet.Columns.Count = 6; FarPoint.Win.Spread.EnhancedInterfaceRenderer outlinelook = new FarPoint.Win.Spread.EnhancedInterfaceRenderer(); outlinelook.RangeGroupBackgroundColor = Color.LightGreen; outlinelook.RangeGroupButtonBorderColor = Color.Red; outlinelook.RangeGroupLineColor = Color.Blue; fpSpread1.InterfaceRenderer = outlinelook; fpSpread1.ActiveSheet.AddRangeGroup(0, 8, true); fpSpread1.ActiveSheet.AddRangeGroup(0, 5, true); fpSpread1.ActiveSheet.AddRangeGroup(1, 3, false); fpSpread1.ActiveSheet.AddRangeGroup(1, 2, false); |
|
| VB |  Copy Code Copy Code |
|---|---|
FpSpread1.ActiveSheet.Rows.Count = 11 FpSpread1.ActiveSheet.Columns.Count = 6 Dim outlinelook As New FarPoint.Win.Spread.EnhancedInterfaceRenderer outlinelook.RangeGroupBackgroundColor = Color.LightGreen outlinelook.RangeGroupButtonBorderColor = Color.Red outlinelook.RangeGroupLineColor = Color.Blue fpSpread1.InterfaceRenderer = outlinelook; FpSpread1.ActiveSheet.AddRangeGroup(0, 8, True) FpSpread1.ActiveSheet.AddRangeGroup(0, 5, True) FpSpread1.ActiveSheet.AddRangeGroup(1, 3, False) FpSpread1.ActiveSheet.AddRangeGroup(1, 2, False) |
|


