


The line chart can be a radar plot such as the one shown in this figure:
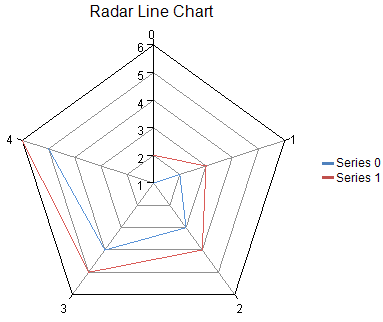
Each point has a single data value: y. Each point is visualized as point on a line.
A radar line series can be assigned a border, fill effect, and a depth for the line. Each point can be assigned a border and a fill effect for the line. Assigning null for a border or fill effect indicates that the property is unset. Depth is measured relative to the plot area depth (0 = no depth, 1 = depth of plot area).
For more information on the line series object in the API, refer to the RadarLineSeries class.