


The bubble chart can be an XY plot such as the one shown in this figure.
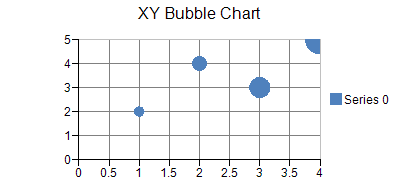
Each point contains two values: value and size.
Bubble borders and fill effects can be assigned for the series or for a point in the series. Null (Nothing in VB) indicates that the property is not set. Bubble size is measured relative to the plot area width (with a range of 0 to 1). Bubble depth is measured relative to the floor grid (with a range of 0 to 1).
For more information on the bubble series object in the API, refer to the XYBubbleSeries class.