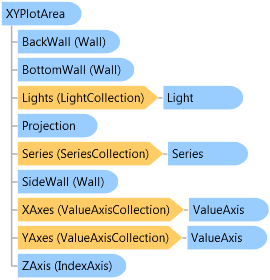
Represents a XY plot area in a chart model.
Object Model

Syntax
'Declaration

Public Class XYPlotArea
   Inherits PlotArea
'Usage

Dim instance As XYPlotArea
public class XYPlotArea : PlotArea
Remarks
The plot area has an x-axis, a y-axis, a z-axis, and up to six walls. The x-axis and y-axis represent values. The z-axis represents series.
Inheritance Hierarchy
System.Object
FarPoint.Win.Chart.PlotArea
FarPoint.Win.Chart.XYPlotArea
Requirements
Target Platforms: Windows 2000 Professional (SP4), Windows 2000 Server, Windows 2003 Server (SP1), Windows 2008, Windows XP (SP2), Windows Vista, Windows 7, Windows 8
See Also