The following graphic illustrates the X and Y axes in C1Chart.
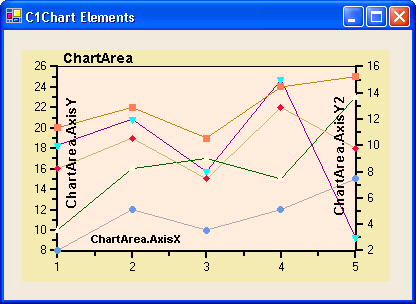
Most charts have two axes, X and Y. The exceptions are pie charts (which have no axes) and charts with a secondary Y axis (Y2, which have three axes).
The axes are represented by sub-properties of the ChartArea property: ChartArea.AxisX, ChartArea.AxisY, and AxisY2. Each of these properties returns an Axis object with the following main properties:
The following properties below represent the layout and style of the axes in C1Chart:
|
Property |
Description |
|
Allows you to set the position of the axis. For example, you may want to display the X-axis above the data instead of below. | |
|
Sets the font used to display the values along the axis. | |
|
Sets the color used to display the axis, tickmarks, and values. | |
|
Allows you to reverse the direction of the axis. For example, you can show Y values going down instead of up. | |
|
Sets a string to display next to the axis (this is typically used to describe the variable and units being depicted by the axis). | |
|
Sets the orientation of the Text string. |
The following properties below represent the format for the annotation of the axes in C1Chart:
|
Property |
Description |
|
A set of predefined formats used to format the values displayed next to the axis. | |
|
The .NET formatting string used to format the values displayed next to the axis when AnnoFormat is set to “NumericManual” or “DateManual”. If the AnnoFormat is set to either NumericManual or DateManual and the AnnoFormatString is empty, then the chart uses an algorithm to find the “best” formatting available. | |
|
Determines what values are displayed next to the axis. Options are “Values”, which displays the actual series values, or “ValueLabels”, which displays the elements in the ValueLabels collection. | |
|
A collection of text/value pairs to display next to the axis when AnnoMethod is set to “ValueLabels”. This property is useful when you want to display strings along an axis instead of numeric values (for example, you may be charting product prices and want to display the product names along the X-axis). | |
|
Allows you to rotate the values so they take up less space along the axis. |
· Scaling Tickmark and Gridline properties
![]()
The following properties represent the scaling, tickmarks, and gridline styles and function for the axes in C1Chart:
|
Property |
Description |
|
Determine whether the minimum and maximum values for the axis should be calculated automatically. | |
|
Set the minimum and maximum values for the axis (when AutoMin and AutoMax are set to False). | |
|
Determine whether the spacing between the major and minor tickmarks should be calculated automatically. | |
|
Set the spacing between the major and minor tickmarks (when the AutoMajor and AutoMinor properties are set to False). | |
|
Returns a ChartGridStyle object with properties that control the appearance of the grid lines drawn perpendicular to major and minor tickmarks. | |
|
Determines whether the X-axis should be automatically positioned with respect to the Y-axis. | |
|
Sets the position of the X-axis with respect to the Y-axis. The X-axis is usually placed at the bottom of the chart. This property allows you to place it so that it crosses the Y-axis at a given coordinate. |
Send comments about this topic to ComponentOne. Copyright © ComponentOne LLC. All rights reserved. |