The following graphic illustrates the ChartArea element in C1Chart.
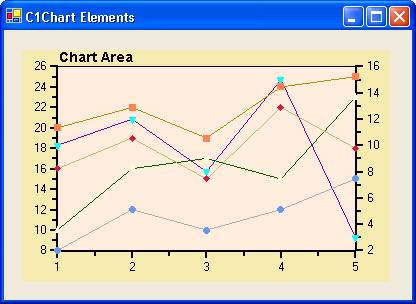
The ChartArea element represents the area of the chart that contains data (excluding the titles and legend, but including the axes). The ChartArea property returns an Area object with the following main properties:
|
Property |
Description |
|
Each of these properties returns Axis objects that allow you to customize the appearance of the chart axes. The Axis objects are described later. | |
|
Allows you to rotate the chart by 90 degrees (this is especially useful to create horizontal bar charts). | |
|
Returns a Margin object that allows you to specify the distance between the chart area and the plot area. The axes labels are displayed in this space. | |
|
Returns a PlotArea object that controls the appearance of the area inside the axes. | |
|
Contains properties that set the color and border of the chart area. |
 Axes Object
Send comments about this topic to ComponentOne. Copyright © ComponentOne LLC. All rights reserved. |