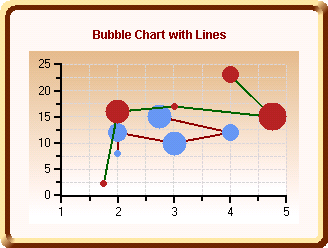
The chart below demonstrates a Standard Bubble chart with lines.

To create a chart of this type, use the same settings as the simple Bubble chart. See Bubble Chart for more information. The only difference with this chart is you will need to change the following property in the ChartDataSeries class:
|
Controls the line style of the series, including color, thickness and pattern. Set the Pattern property to Line. |
Send comments about this topic to ComponentOne. Copyright © ComponentOne LLC. All rights reserved. |