The following image illustrates a basic bubble chart.
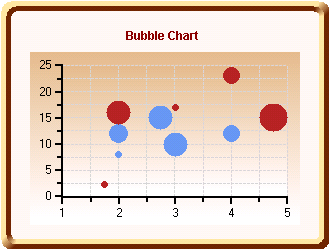
To create a basic Bubble chart, several things will need to be specified. The X-axis and y-axis settings display the location of the bubble on the chart. In addition to these, a y1-axis will also need to be specified. The y1-axis determines the size of the bubble. Set the following properties to create a Bubble chart:
|
Controls the style of the chart. Set this property to Bubble to create a bubble chart. | |
|
Determines the order in which the series entries of each ChartGroup appear in the legend. By setting this to False, the legend will be ordered by the default. If it is set to True, the order of the legend items will be reversed. In this sample, the LegendReversed property is set to False, however the Visible property is also set to False which means it will not be displayed at this time. | |
|
Determines whether figures drawn should be outlined in the PlotArea ForeColor. In this case, we set this property equal to True. | |
|
Determines whether the chart should stack the data. Set the Stacked property to False. | |
|
Determines whether 3D effects are used for charting the data in the ChartGroup. In this example, this property will be set to False. | |
|
Determines whether the ChartGroup is visible. Set this property to True so that the chart data will be displayed in the plot area of the chart. |
In addition to the general properties, set the following properties from the ChartDataSeries class:
|
Controls the line style of the series, including color, thickness and pattern. Set the Pattern property to None. | |
|
Controls the symbol style of the series, include color, size and shape. In this example, set the Shape, Color, and Size properties to the desired settings for your data series. |
Send comments about this topic to ComponentOne. Copyright © ComponentOne LLC. All rights reserved. |