The FunctionBase Collection Editor is used for adding or modifying functions for plotting data at design time. For more information on using the functions for plotting data, see Plotting Functions.
To Access the FunctionBase Collection Editor
1. Right-click on the C1Chart control and select Properties from its context menu.
2. Expand the ChartGroups node in the Properties window.
3. Expand the Group0 node and then select the FunctionsList property and click the ellipsis button.
The FunctionBase Collection Editor appears.
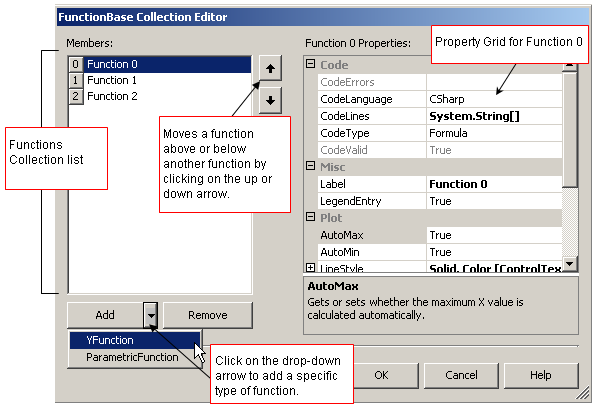
Base parts of the FunctionBase Collection Editor
The following figure illustrates the elements in the FunctionBase Collection Editor:
The following properties are available for the user in the FunctionBase Collection Editor at design time or they can be used in the FunctionBase class at run time:
Available Properties in the FunctionBase
Collection Editor ![]()
The code properties specify the type and language of the function's code as well as the multi-line presentation for the code. The code properties and their descriptions are listed below:
|
Members |
Description |
|
Gets the string descriptions of any compiler errors. | |
|
Gets or sets the programming language used for compiling VB or C#. The user can specify which language by clicking on the drop-down button in the Code Language textbox and selecting the language. | |
|
CodeLines |
Gets or sets the multi-line presentation of the function code. By clicking the ellipsis button you can enter code into the listbox of the collection string editor. |
|
Gets or sets whether the code will be compiled as a formula, method, or as a full compile unit. | |
|
Gets whether the function compiles correctly. |
Misc Properties of the FunctionBase Collection Editor
The miscellaneous property and their functions are listed below:
|
Members |
Description |
|
Gets or sets the label of the function. | |
|
Gets or sets whether the function will be shown in the legend. |
Plot Properties of the FunctionBase Collection Editor
The plot properties are used to modify the style or functionality of the chart data series plots used in your function. The plot properties and their descriptions are listed below:
|
Members |
Description |
|
Gets or sets whether the maximum X value is calculated automatically. | |
|
Gets or sets whether the minimum X value is calculated automatically. | |
|
Gets or sets the line style used for plotting the function. | |
|
Gets or sets the maximum X value of the plotted function. | |
|
Gets or sets the minimum X value of the plotted function. | |
|
Gets or sets the method used for plotting the function. | |
|
Gets or sets the number of points used when plotting the function. | |
|
Gets or sets whether the function is plotted over or behind the data series plots. | |
|
Gets or sets whether the function plot is visible. |
Send comments about this topic to ComponentOne. Copyright © ComponentOne LLC. All rights reserved. |