ComponentOne 2D Chart is a two-dimensional charting control that you can use in your Windows applications to provide users with professional information display and manipulation capabilities.
2D Chart Control
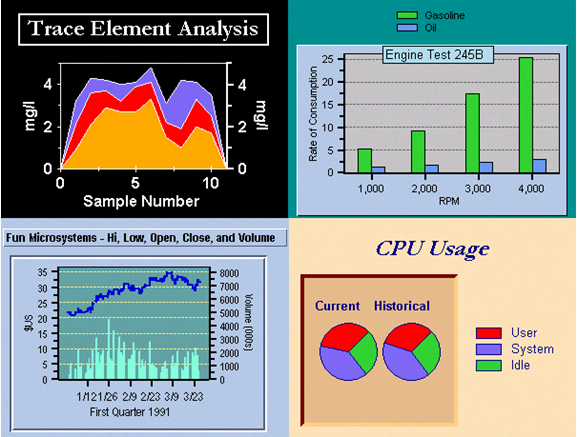
Use the 2D Chart to display data as a Bar, XY-Plot, Area, Pie, Radar, Polar, Candle, or a combination of any of these charts. 2D Chart is optimized for real-time applications displaying rapidly changing data.
C1Chart 2D for .NET Features
· 100% Managed Code
· X-Y Plot, Area, Bar, High-Low, High-Low-Open-Close, Gantt, Candle, Bubble, Pie, Radar, and Polar charts provides various ways to display data.
· Stacking Charts: XY-Plot, Area, Bar, Radar, and Plot charts can be stacked to display more complex data in a smaller space.
· Mouse tracking capabilities keep track of the region, series, or data point under the mouse pointer.
· Image generation: Charts can be saved to any number of image formats (metafile, .bmp, .jpg, and more).
· Interactive Wizard.
Send comments about this topic to ComponentOne. Copyright © ComponentOne LLC. All rights reserved. |