The C1Chart control has a rich object model that allows you to create a variety of chart types and control their appearance and behavior.
This chapter introduces the C1Chart object model by describing the main elements in the chart and the main properties related to each one. By the end of this chapter, you will have a good understanding of the main elements of the C1Chart object model which will help you when you use C1Chart to create your chart. Later sections drill down into greater detail, covering the remaining parts of the programming model.
2D Chart Terminology
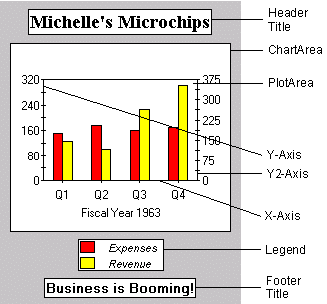
The following diagram shows the terms used to describe chart elements:

Note: Pie charts contain the same elements except for the axes.
The following topics describe the elements listed in the preceding graphic and the main properties associated with each element.
 Defining the Header and Footer Elements
Send comments about this topic to ComponentOne. Copyright © ComponentOne LLC. All rights reserved. |