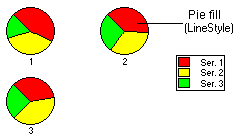
A Pie chart draws each series as a slice in a pie. The number of pies is the number of points in the data. Each pie displays the nth data point in each series. Using the LineStyle, the fill properties of each series can be customized. For more information, see Line and Symbol Styles for the Series.
To set the chart type to Pie at design time
· Expand the ChartGroups node in the Properties window. Open the ChartGroups Collection Editor by clicking the ellipsis button. In the right pane of the editor, set the ChartType property to Pie.
· An alternate method to change chart type is to right-click the existing chart and select Chart Properties. From the Gallery, select ChartType as Pie.
· Another alternate method is to select Chart Properties, from the Properties pane. From the Gallery, select ChartType as Pie.
 Pie Chart Programming Considerations
Send comments about this topic to ComponentOne. Copyright © ComponentOne LLC. All rights reserved. |