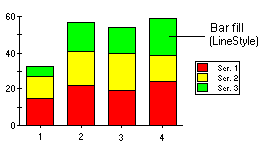
A Stacking Bar chart draws each series as a portion of a stacked bar cluster, the number of clusters being the number of points in the data. Each bar displays the nth data point in each series. Cylinder, Pyramid, and Cone Bar charts can also be stacked by setting the Stacked property to True. Using the LineStyle, the fill properties of each series can be customized. For more information, see Line and Symbol Styles for the Series.
Send comments about this topic to ComponentOne. Copyright © ComponentOne LLC. All rights reserved. |