To create a custom color for the Chart Data Series, complete the following steps:
1. Open the Chart Properties designer. For details on how to access the Chart Properties designer see Working with the Chart Properties Designer.
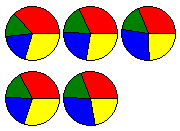
2. Set series 0 to red, series 1 to green, series 2 to blue, and series 3 to yellow. For details on how to apply color to the data series using the Chart Properties designer see Modify the Appearance of the Data Series. The colors for each series appear like the following.
3. Open the Visual Effects Designer. For details on how to access the Visual Effects designer see Access the Visual Effects Designer.
4. In the Available Elements list box, click on the box next to Default. The default visual effects settings for the data series appear on the Chart2D control.
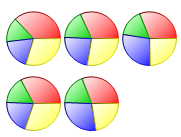
5. Click on the Colors tab, and then slide the Brightness slider to the value -55. The color appears less bright.
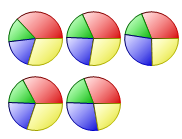
6. Slide the Saturation slider to the right and stop at 100. The Saturation is increased to 100% and the color tone appears more pure and vivid.
The original colors for the data series are enhanced.
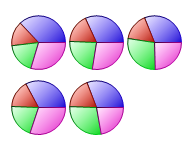
As an option, to change the colors for the data series, complete the following
· In the Colors tab, slide the HueShift slider to 247. Notice as you move the slider the colors change.
Send comments about this topic to ComponentOne. Copyright © ComponentOne LLC. All rights reserved. |