The chart below demonstrates a Standard Line chart with a basic X-Y axis.
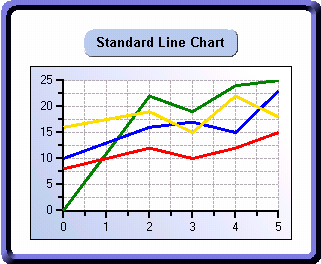
X-Y charts represent connected points of data. To create a simple X-Y Line chart, the following properties can be set under the ChartGroup class:
|
Controls the style of the chart. Set this property to XYPlot to create a standard line chart. | |
|
Determines the order in which the series entries of each ChartGroup appear in the legend. By setting this to False, the legend will be ordered by the default. If it is set to True, the order of the legend items will be reversed. In this sample, the LegendReversed property is set to False, however the Visible property is also set to False which means it will not be displayed at this time. | |
|
Determines whether figures drawn should be outlined in the PlotArea ForeColor. In this case, we set this property equal to True. | |
|
Determines whether the chart should stack the data. Set the Stacked property to False. | |
|
Determines whether 3D effects are used for charting the data in the ChartGroup. In this example, this property will be set to False. | |
|
Determines whether the ChartGroup is visible. Set this property to True so that the chart data will be displayed in the plot area of the chart. |
Send comments about this topic to ComponentOne. Copyright © ComponentOne LLC. All rights reserved. |