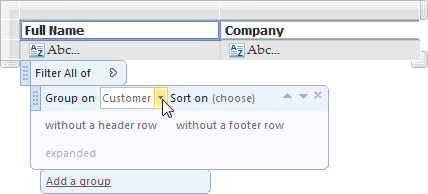
Grouping is used to organize data in a table. You can group data by attributes or entities within the entity used to create the table. By default, table data is grouped by the entity you drag onto the report to create the table.
You can see which attribute groups the data by clicking the table so that the adorner menu appears.

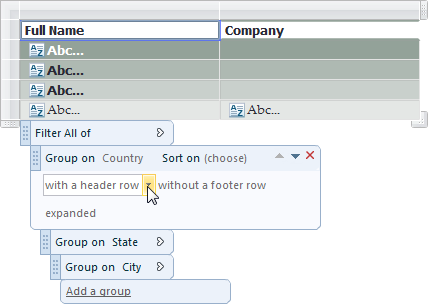
If a table has more than one group (see Reordering Groups), the table data is grouped as an inclusive tree. So, if a table (for example, one based on the Customer entity) has three groups, Country, State, and City, then the table data is grouped first by country, then by state, then by city.

The default grouping does not display a header row, but for added groups, the group value is displayed by default at the beginning of each new instance of the data group in a group header row. To change it, click with (or without) a header row and select the setting that you want. To display group subtotals, add a group footer row. For more information, see the Table Grouping topics below:
- Changing the Default Grouping
- Adding a New Group
- Deleting a Group
- Reordering Groups
- Adding a Group Header and Footer
- Collapsing a Group (drill down reports)
- Sorting Data