


 Show All
 Hide All
The Layout Loader sample demonstrates the use of main form with the Viewer and the Windows ListBox control that displays a list of reports from the sample Reports folder. The Layout Loader sample summarizes the following seven sample reports in a single sample.
- Invoice1
- Invoice2
- LabelReport
- PaymentSlip
- PurchaseOrder
- Schedule
- UnderlayNext


<User Folder>\ComponentOne Samples\ActiveReports Developer 7\Section Reports\VB.NET\Layout\LayoutLoader
<User Folder>\ComponentOne Samples\ActiveReports Developer 7\Section Reports\C#\Layout\LayoutLoader
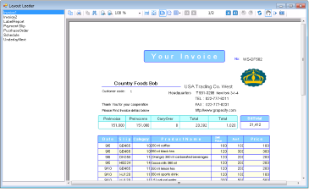
When you run this sample, the main form appears, with the list of the sample reports in the Windows ListBox control on the left of the form. Double-click the report from the list to have it displayed in the Viewer control on the right of the form.
 |
Note: To run this sample, you must have access to the Shiire.mdb, BILL.mdb, Nwind.mdb, Seikyu2.mdb and Schedule.mdb. A copy is located at [User Documents folder]\ComponentOne Samples\ActiveReports Developer 7\Data. If you are unable to access the data files in the sample, create the Data folder and place all the data files to this folder, or change the reference path to the data files within the folder according to your environment. |
The Reports folder contains .rpx reports that are displayed on the main ViewerForm when the sample project is run.
The report calculates the invoice total amount for each customer along with purchase details. The report also displays the average of the previous invoice amount, the current invoice amount and the consumption tax.
|
Note: To run this sample, you must have access to the BILL.mdb. A copy is located at [User Documents folder]\ComponentOne Samples\ActiveReports Developer 7\Data. If you are unable to access the data files in the sample, create the above folder to place all the data files or change the reference path to the data files within the folder according to your environment. |
This section contains the Label and Textbox controls. It uses the bound data fields to calculate the invoice information in the header.
The values of the Excise and BillTotal Textbox controls are set in the Script tab and are calculated in the BeforePrint event.
|
Note: This sample uses bound fields on the PageHeader section, assuming that the value of all records to be displayed on a page does not change. However, we do not recommend that you place bound fields on the PageHeader or PageFooter sections because these sections are displayed on a page once. For the same reason we do not recommend that you place bound fields on the GroupHeader and GroupFooter sections. |
This section contains the Label controls that are captions for the information displayed in the Detail section.
This section also uses the CrossSectionLine and the CrossSectionBox controls that span the ghColumnCaption section to end in the Detail section, forming vertical lines between columns of the invoice details and a rectangle around the details of the invoice at run time.
This section contains the bound TextBox controls that control display each row of data associated with the current ghColumnCaption.
The Shape control is used to alternate row colors in the Detail section. Go to the Script tab and see the shpDetailBack.BackColor property in the Detail_Format event.
When you run this sample, one set of the two pages report is displayed in the Viewer control.
|
Note: To run this sample, you must have access to Seikyu2.mdb. A copy is located at [User Documents folder]\ComponentOne Samples\ActiveReports Developer 7\Data. If you are unable to access the data files in the sample, create the above folder to place all the data files or change the reference path to the data files within the folder according to your environment. |
This section contains the Label and Textbox controls. It uses the bound data fields to calculate the invoice information in the header.
The values of the Year, Month and Day Textbox controls are set under the Script tab and are calculated in the ReportStart event.
It also uses the CrossSectionLine and the CrossSectionBox controls that span the GroupHeader1 section to end in the GroupFooter1 section, forming vertical lines between columns of the invoice details and a rectangle around the details of the invoice at run time.
This section uses the data table tb_Main as the main report data and the data table tb_Count to retrieve the number of data items within a group.
The Detail data in each group is retrieved beforehand to calculate the required number of empty rows. For the required empty row count, substitute data with "" in the FetchData event.
The Shape control is used to alternate row colors in the Detail section. Go to the Script tab and see the shpDetailBack.BackColor property in the Detail_Format event.
This report displays the tack seal, which is commonly used in postal services. This multi-column report uses the customer barcode that is bound to data by using the DataField property.
|
Note: To run this sample, you must have access to the Nwind.mdb. A copy is located at [User Documents folder]\ComponentOne Samples\ActiveReports Developer 7\Data. If you are unable to access the data files in the sample, create the above folder to place all the data files or change the reference path to the data files within the folder according to your environment. |
This section contains the bound data fields to display the contact information and the Barcode control that is bound to data by using the DataField property.
The ColumnCount property is set to 3, which allows the report to display the tack seal in 3 columns.
The report displays the invoice payment slip with the GS1-128 barcode that is used for payment services in convenience stores. GS1-128 is the convenience store barcode, formerly called UCC/EAN-128.
In general, GS1-128 is used for payment purposes by convenience stores that require high accuracy. However, the reading accuracy of the barcode may be reduced due to the printer resolution, the page size or the ink. To avoid this issue, we use the EAN128FNC1 barcode for the dotted correction of blackbar in this Sample report.
|
Note: To run this sample, you must have access to the BILL.mdb. A copy is located at [User Documents folder]\ComponentOne Samples\ActiveReports Developer 7\Data. If you are unable to access the data files in the sample, create the above folder to place all the data files or change the reference path to the data files within the folder according to your environment. |
The report displays the purchase slip. Purchase slips are created based on the bound data. This report groups data for each purchase slip. The detail count is not fixed but the number of rows in the report layout is fixed. In this case, when the RepeatToFill property of the Detail section is set to True, the detail data is repeatedly displayed on the entire page.
The report uses the RepeatToFill property and calculated fields to demonstrate how to create the report layout without any code. The calculated fields are used to calculate the total cost and the total selling price.
|
Note: To run this sample, you must have access to the Shiire.mdb. A copy is located at [User Documents folder]\ComponentOne Samples\ActiveReports Developer 7\Data. If you are unable to access the data files in the sample, create the above folder to place all the data files or change the reference path to the data files within the folder according to your environment. |
This section contains the Textbox controls. It uses the bound data fields to calculate the product information in the body of the report.
The detail.BackColor property is used to alternate row colors in the Detail section. Go to the Script tab and see the detailBack.BackColor property in the detail_Format event.
The sample report displays the weekly schedule of employees in the gantt chart format. The report displays six day report schedules on a single page in the Viewer control.
|
Note: To run this sample, you must have access to Schedule.mdb. A copy is located at [User Documents folder]\ComponentOne Samples\ActiveReports Developer 7\Data. If you are unable to access the data files in the sample, create the above folder to place all the data files or change the reference path to the data files within the folder according to your environment. |
The Gantt chart view is created by using the Label control and the Line control. You can display the horizontal bars like in the gantt chart by modifying the size of the Label control. To add horizonal bars, you can dynamically add twenty four (12 x 2) Label controls within the 9-20 hours time frame that will become the horizontal bars of gantt chart in the ReportStart event. Once they are added, set the Visible property to False to hide them.
You can adjust the width of horizontal bars by setting calculated values from the time width in the Tag property of the Label control within Detail_Format event. For the horizontal adjustment of bars, change the width of the Label control to match with the value in the Tag property.
To display multiple reports within the Detail section, the Date data is compared with previous records in the DetailFormat event and if the dates match, only the record pointer is moved by dynamically switching the LayoutAction property without changing the output positioning of Detail.
The report displays the list of customers based on the bound data.
|
Note: To run this sample, you must have access to Nwind.mdb. A copy is located at [User Documents folder]\ComponentOne Samples\ActiveReports Developer 7\Data. If you are unable to access the data files in the sample, create the above folder to place all the data files or change the reference path to the data files within the folder according to your environment. |
This section contains the bound Textbox control, Country, and the CrossSectionLine controls to create the table for the report body data.
The UnderlayNext property of this section is set to True to align the beginning position of the report data in the Detail section with the GroupHeader1 section.
This section contains the bound Textbox controls to display the report data.