The C1FlexGrid control allows you to display, edit, group and summarize data in a grid format. The grid can be bound to a data source or it can manage its own data.
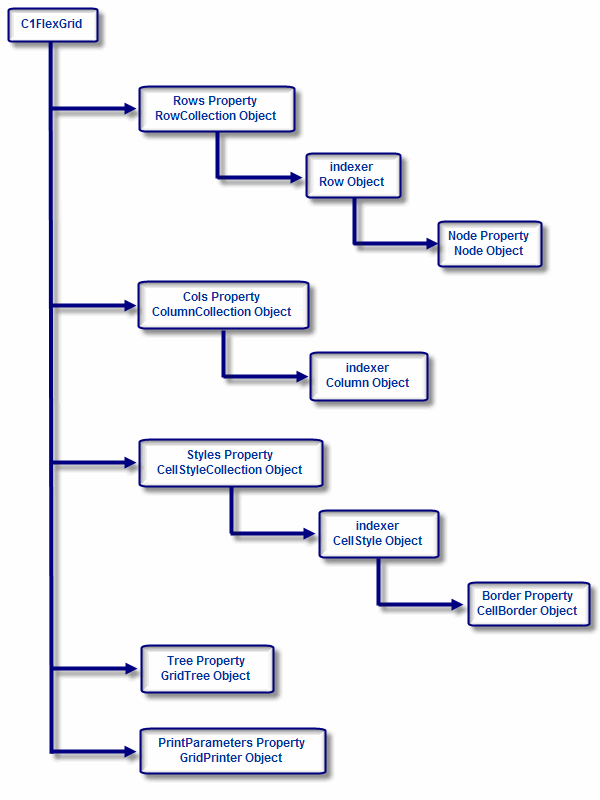
The C1FlexGrid control has a rich object model with the following elements:

The following topics walk you through the main features in the C1FlexGrid control:
Describes how to set up the grid dimensions and layout.
Describes the concepts of "current cell" and "selection".
Describes how to work with a group of cells as a single unit.
Describes how to display images in a cell.
Describes how to customize the appearance of the grid by formatting numbers, dates, and Boolean values, or by changing fonts, colors, alignment, and pictures for individual cells or ranges.
Describes how to implement simple text editing, drop-down lists and combo lists, cell buttons, editing masks, and data validation.
Describes how to change the grid display so that cells with similar contents are merged, creating "grouped" views that highlight relationships in the data.
Outlining and Summarizing Data
Describes how to add subtotals to grids and how to build outline trees.
Describes how you can save the contents or formatting of a grid and re-load it later, or exchange grid data with other applications such as Microsoft Access and Excel. This section also shows how you can print grids.
Presents a map of the main C1FlexGrid properties cross-referenced by function.