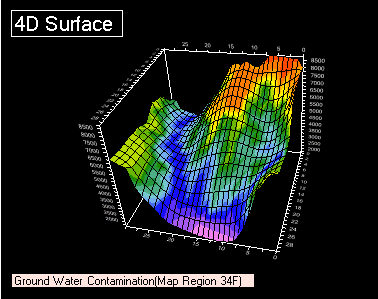
3D Chart enables developers to represent four-dimensional plots and Bar charts using color as the fourth dimension.
A 4D chart uses color to display a fourth dimension of data on a 3D Surface or Bar chart. The colors come from a second set of data that the chart uses for the zoning and contouring colors. 4D charts are useful for visualizing two sets of identically sized data in one chart.