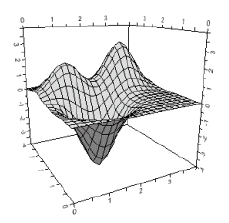
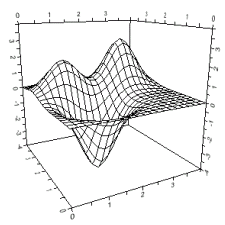
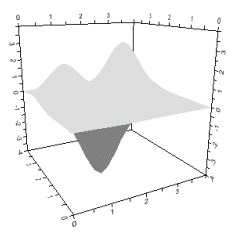
Surface Example
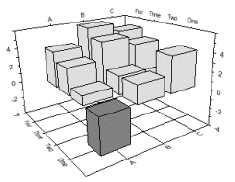
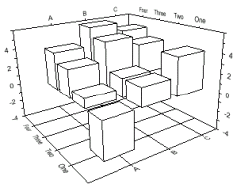
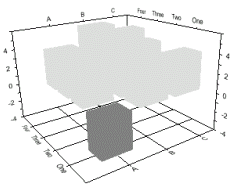
Bar Example
The basic appearance of the Surface and Bar chart types is controlled by the combination of two properties: IsMeshed and IsShaded. These properties are located in the Chart3DGroup Collection Editor (IsMeshed and IsShaded under the Elevation node) that can be accessed through the ChartGroups property in the .NET Properties window.
Using IsMeshed
When the IsMeshed property is set to True for Surface or Bar charts it displays each chart type as the following:
•Surfaces: The chart displays the X-Y grid projected onto the 3D surface in a 3D view with a Z-axis. The chart honors rotation and perspective control.
•Bars: The chart draws the outline of all bars.
Surface Example | Bar Example |
|
|
Note: The chart’s top and bottom mesh color and other mesh properties can be customized.
Using IsShaded
When the IsShaded property is set to true for Surface or Bar charts it displays each chart type as the following:
•Surfaces: The chart displays the data as a flat shaded surface in a 3D view with a Z-axis. Top and bottom shading colors may be set. The chart honors rotation and perspective control.
•Bars: The chart draws the bars as a flat shade.
Note: The chart’s top and bottom surface color and other surface properties can be customized.
Using IsMeshed and IsShaded
Use a combination of the IsMeshedandIsShaded properties to set the chart’s basic appearance.
In this example the IsShaded and the IsMeshed properties are both set to True to display a Shaded and Meshed Surface 3D and Bar chart.
Surface Example | Bar Example |
|
|